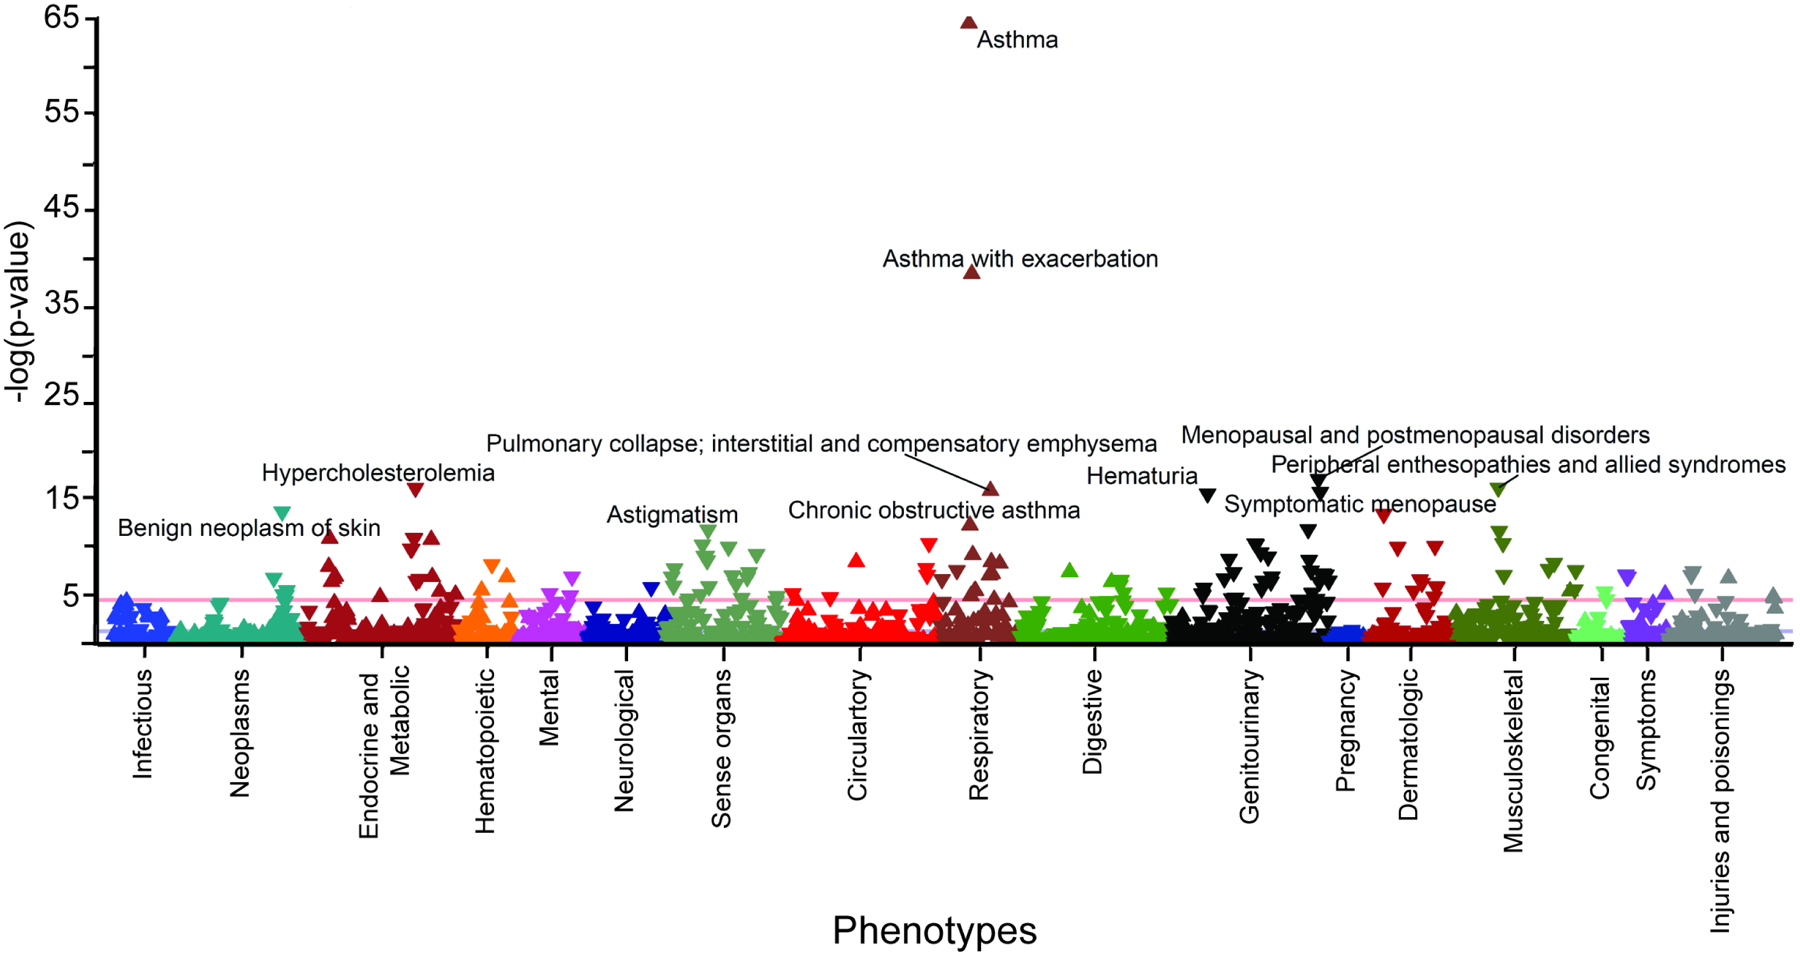
Figure 4. A plot of PheWAS analysis of the asthma PRS within the combined Training and Validation cohorts.

Manhattan plots of phenome-wide association analyses with phecodes (X-axis) and FDR-corrected PheMap phenotype probability (y-axis). The red line indicates the Bonferroni level of significance (5.0 × 10⁻⁵).
