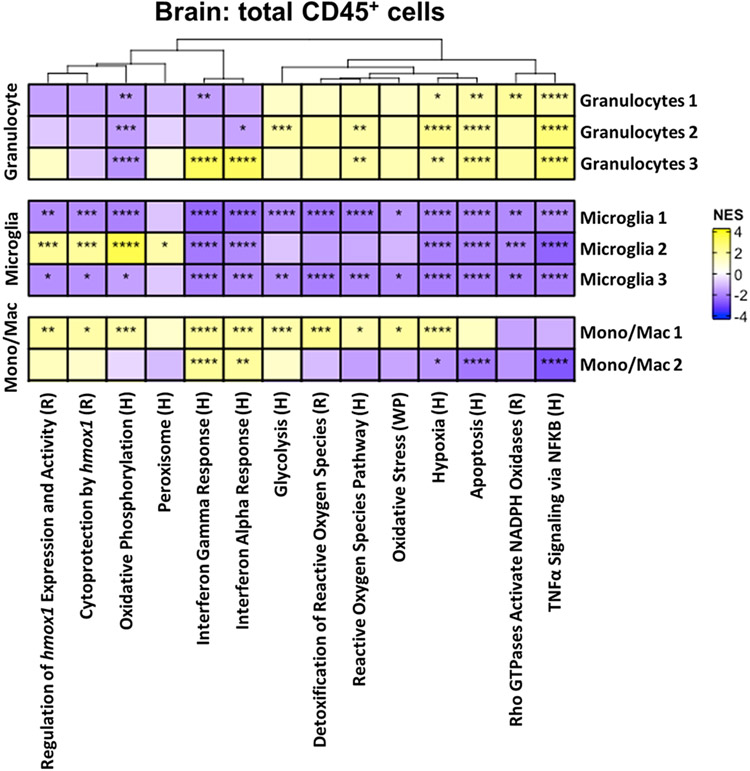
Figure 8. Pathway analysis of total brain CD45+ cells during S. aureus craniotomy infection.
The heat map depicts significantly enriched pathways using the total events (dsRed+ and dsRed−) of each cluster compared to all other populations. Significance of the normalized enrichment scores (NES) for gene set enrichment analysis (GSEA) is denoted (*, p < 0.05; **, p < 0.01; ***, p < 0.001; and ****, p < 0.0001). H= Hallmark pathway; R= Reactome pathway; WP= WikiPathways.

