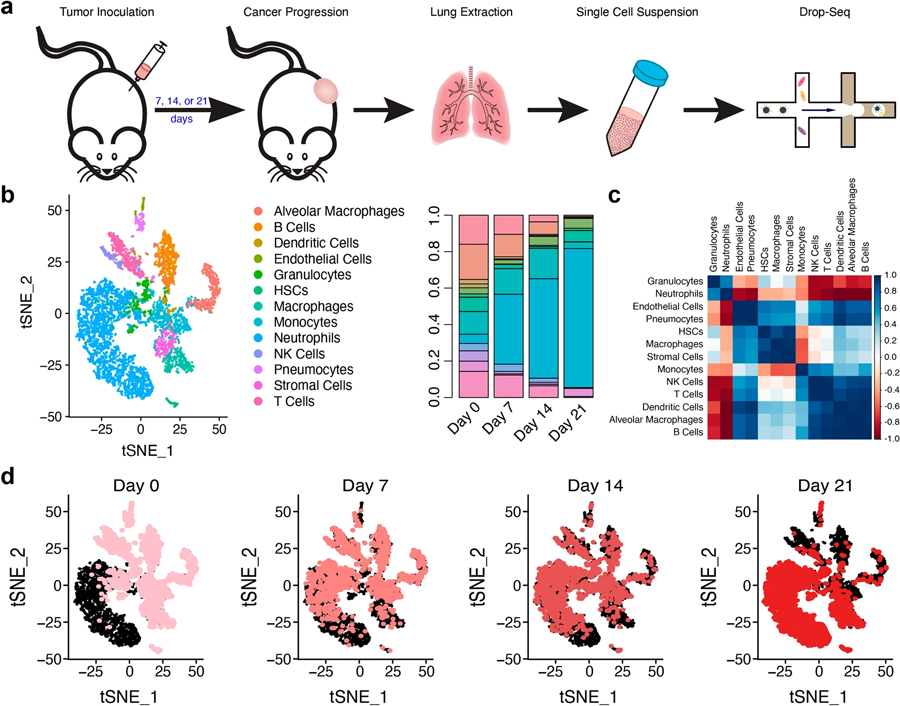
Fig. 1.

The cellular composition of the lung is dynamic in metastatic progression. a Female Balb/c mice received an orthotopic inoculation of the triple-negative metastatic breast cancer cell line, 4T1. Tumors progressed for either 7, 14, or 21 days, the lungs were explanted, and the tissues were processed into a single-cell suspension. Library preparation was completed using the Drop-Seq platform. b tSNE plot showing the 13 major cell clusters identified in the lung. The proportion of each cell type was time dependent and disease progression was marked by an influx of neutrophils. c Correlation plot of the changes in each cell population over time. Pearson correlations were calculated by comparing the cell proportions at each time point. d tSNE plots over time clearly depict a shift in cell populations. Pink dots (which get darker over time) identify cells at the designated time, while black dots identify the cells at the other time points
