Fig. 5.

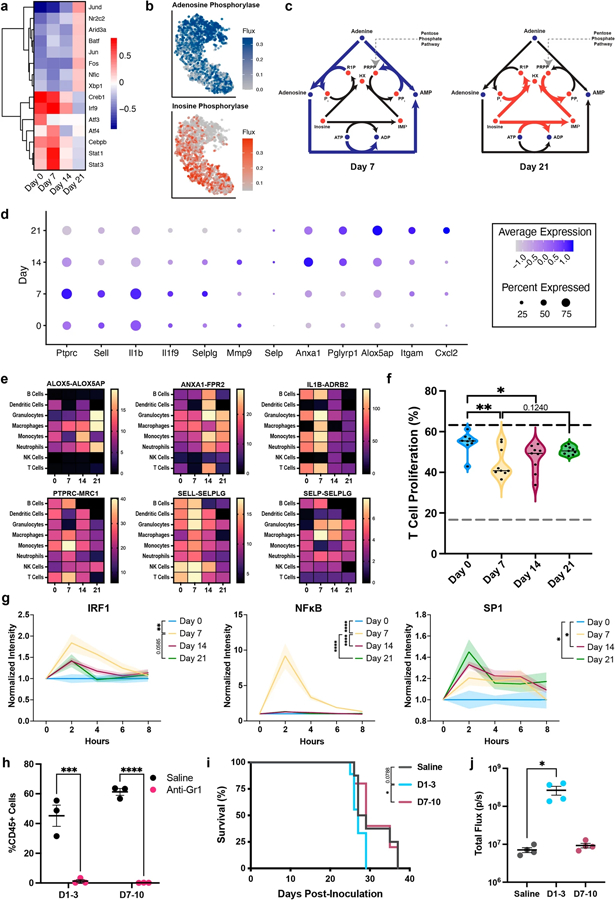
Neutrophil signaling changes throughout metastatic progression. a Heat maps of the most variably active transcription factors in the neutrophils as predicted by DoRothEA. b tSNE plots showing a selection of adenosine- and inosine-related metabolic reactions in the neutrophils. Metabolic events were determined through the gene expression of each cell and independent of time. c Schematics demonstrating the shift in metabolism from adenosine to inosine. Metabolic shifts were assessed using the time course data in Fig. 4. d Dot plot of the twelve time-dependent neutrophil-specific ligands as predicted by NicheNet. e Heat maps of the receptor-ligand interaction values with other immune cell types for select neutrophil ligands. f Percent of T cells that proliferated after 72 h exposure to conditioned medium. Dotted gray line = negative control, dotted black line = positive control. The black line in the violin plots indicate the median of the data set. g Transcription factor activity in 4T1 cells exposed to conditioned medium. h Gr1 + cells (neutrophils and monocytes) were depleted in the lung following two systemic doses of anti-Gr1 antibody. Depletion of early Gr1 + cells i decreased survival outcomes and j increased metastatic burden, *p < 0.05, **p < 0.01, ***p < 0.001, ****p < 0.0001
