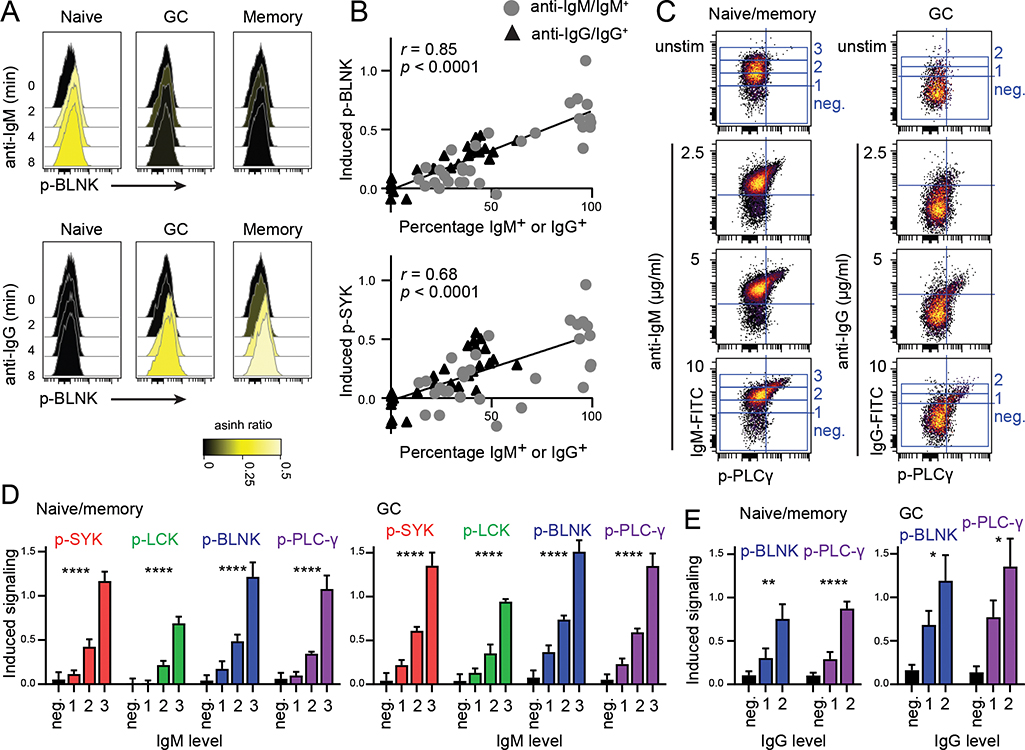
Figure 1. BCR signaling strength correlates with level of BCR expression in primary human B cells.
A. BCR signaling was induced with anti-IgM F(ab’)2 or anti-IgG F(ab’)2 in single-cell suspensions from human tonsils and analyzed by phospho-flow. Gating of B-cell subsets is shown in Supplemental Fig. 1A. B: In separate experiments using the same tonsils, the percentage of IgM+, IgD+, IgG+ and IgA+ B cells were calculated from surface phenotyping (Supplemental Fig. 1B, 1C). Induced signaling (arcsinh ratio of median relative to unstimulated cells) is plotted against percentage of IgM+ and IgG+ cells for each population in each tonsil. Line indicates simple linear regression of all data points. Pearson r and significance is indicated. C-E. For simultaneous measurement of surface Ig level and signaling readout, signaling was induced by FITC-labeled anti-IgM F(ab’)2 or anti-IgG F(ab’)2. In unstimulated cells, FITC-labeled anti-Ig F(ab’)2 was added after PFA fixation. C. Anti-IgM-induced signaling in naive/memory B cells and IgG-induced signaling in GC B cells is shown for one representative tonsil. D. Surface IgM-negative cells and three populations of IgM-positive cells were gated in unstimulated and stimulated cells (gating shown in C). Induced signaling was measured in GC B cells or naïve/memory B cells within specific IgM levels relative to the same Ig level in unstimulated cells (arcsinh ratio of median). Mean and SD, n = 4. *indicates significance after ANOVA tested for the three IgM+ populations. ****p < 0.0001. E. Similarly, surface IgG-negative and two levels of IgG-positive cells were gated and signaling were measured within specific IgG levels. Mean and SD, n = 4. *indicates significance after t-test of the two IgG+ populations. *p < 0.05, **p < 0.01, ****p < 0.0001.

