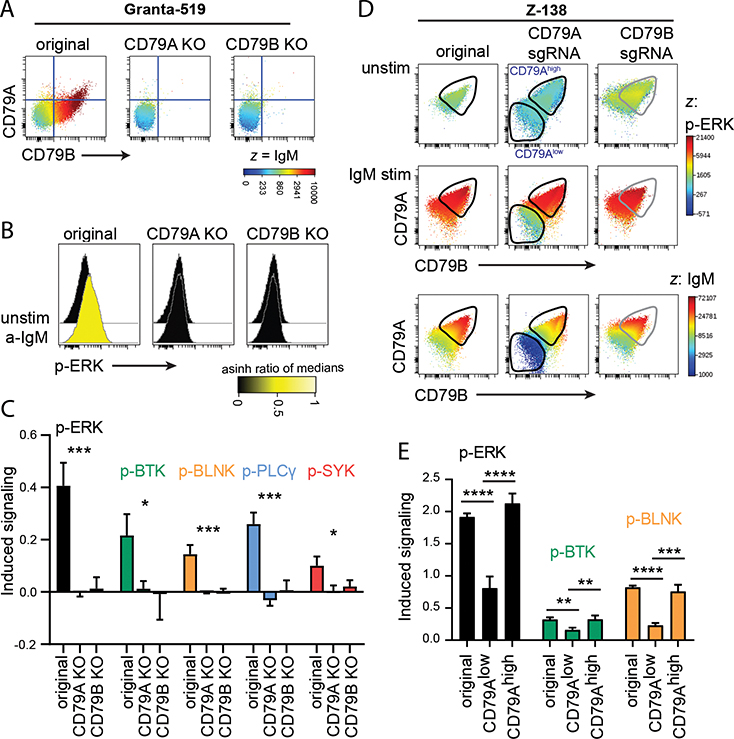
Figure 4: B cells lacking surface BCR are incapable of BCR-induced signaling.
A. Surface expression of CD79A, CD79B and IgM is shown in Granta-519 original, CD79A KO (clone II-G6) and CD79B KO (clone E4). B-C. Granta-519 original, CD79A KO and CD79B KO clones were stimulated with anti-IgM F(ab’)2. Phosphorylation was measured by intracellular phospho-flow. One representative experiment (B) or phosphorylation of several proteins (C).
D-E. Z-138 was transfected with CD79A or CD79B sgRNA. Cells were frozen after 10 days, then thawed and cultured for 9 days. The original cell line and the two sgRNA-transfected cell lines were stimulated with FITC-labeled anti-IgM F(ab’)2 for simultaneous induction of BCR signaling and detection of IgM surface level. Phosphorylation and intracellular levels of CD79A and CD79B were measured by phospho-flow. D: Unstimulated and stimulated cells are plotted and gated on CD79A+ unedited cells and CD79Alow edited cells. CD79B-edited cells are shifted towards CD79Blow cells, however, the small population of CD79B−IgM− cells are not distinguished from CD79B−IgM+ cells that signal as original cells. E: Phosphorylation of several proteins in original Z-138 and CD79A-edited cells gated on CD79A+ unedited cells and CD79Alow edited cells. Values are shown relative to unstimulated cells, using arcsinh transformed data of median. Mean ± SD, n = 3. *indicates significance after ANOVA (C) with Tukey’s multiple comparison test (E). *p < 0.05, **p < 0.01, ***p < 0.001, ****p < 0.0001.

