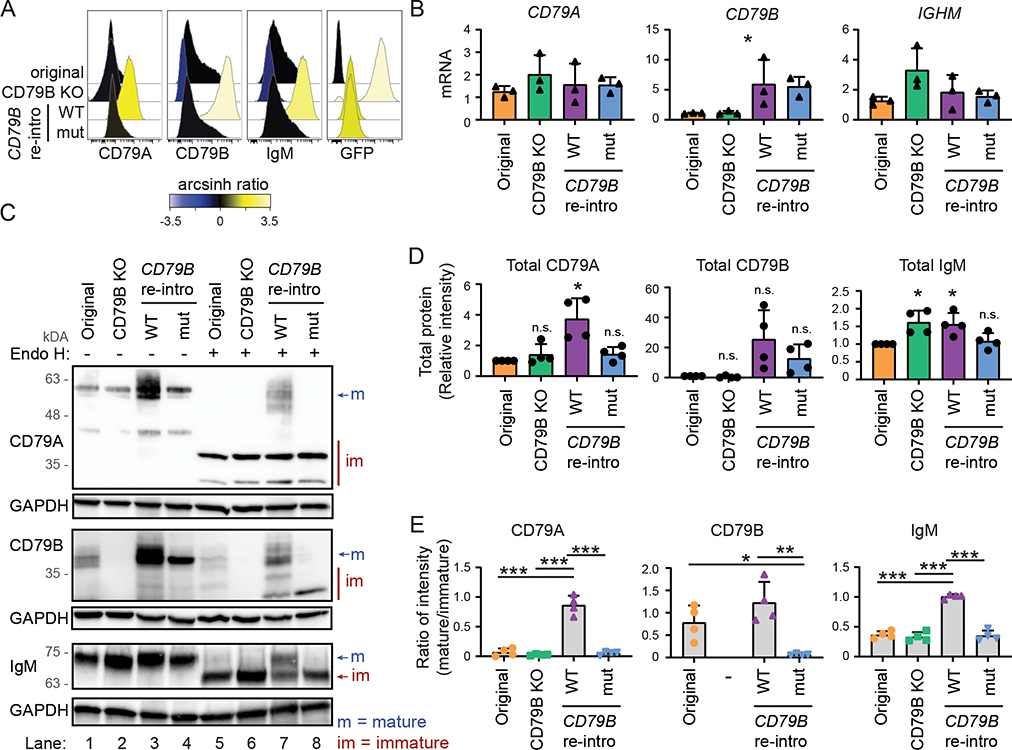
Figure 7: BCR surface expression and protein maturation in CD79B KO cells can be rescued by reintroducing CD79B.
Wild type CD79B and mutant CD79B G137S were re-introduced into Granta-519 CD79B KO cells (clone E4) by retroviral transduction. A: Surface protein expression was measured by flow cytometry. One representative out of three experiments is shown. All blots are shown in Supplemental Fig. 4D. B: mRNA level of CD79A, CD79B and IGHM were measured by real-time RT PCR. Mean ± SD (n = 3). *indicates significance after ANOVA, Tukey’s multiple comparison test did not show significance. C: Protein lysates were left untreated or treated with Endo H for 1 hour before western blot analysis. One representative out of three experiments is shown. D: The intensity of the bands in lane 1–4 (total protein level) were quantified and plotted relative to total protein expression in original cells (lane 1). Mean ± SD, (n = 3). * indicates significance after one-sample t-test comparing sample means of CD79B KO, reintroduction of CD79B WT or CD79B G137S to 1. E: The intensity of the mature and immature fraction of the bands in lane 5–8 of CD79A, CD79B and IgM were quantified and plotted as ratio between mature and immature fraction. Mean ± SD, (n = 4). *indicates significance after ANOVA and Tukey’s multiple comparison test *p < 0.05, **p < 0.01, ***p < 0.001.

