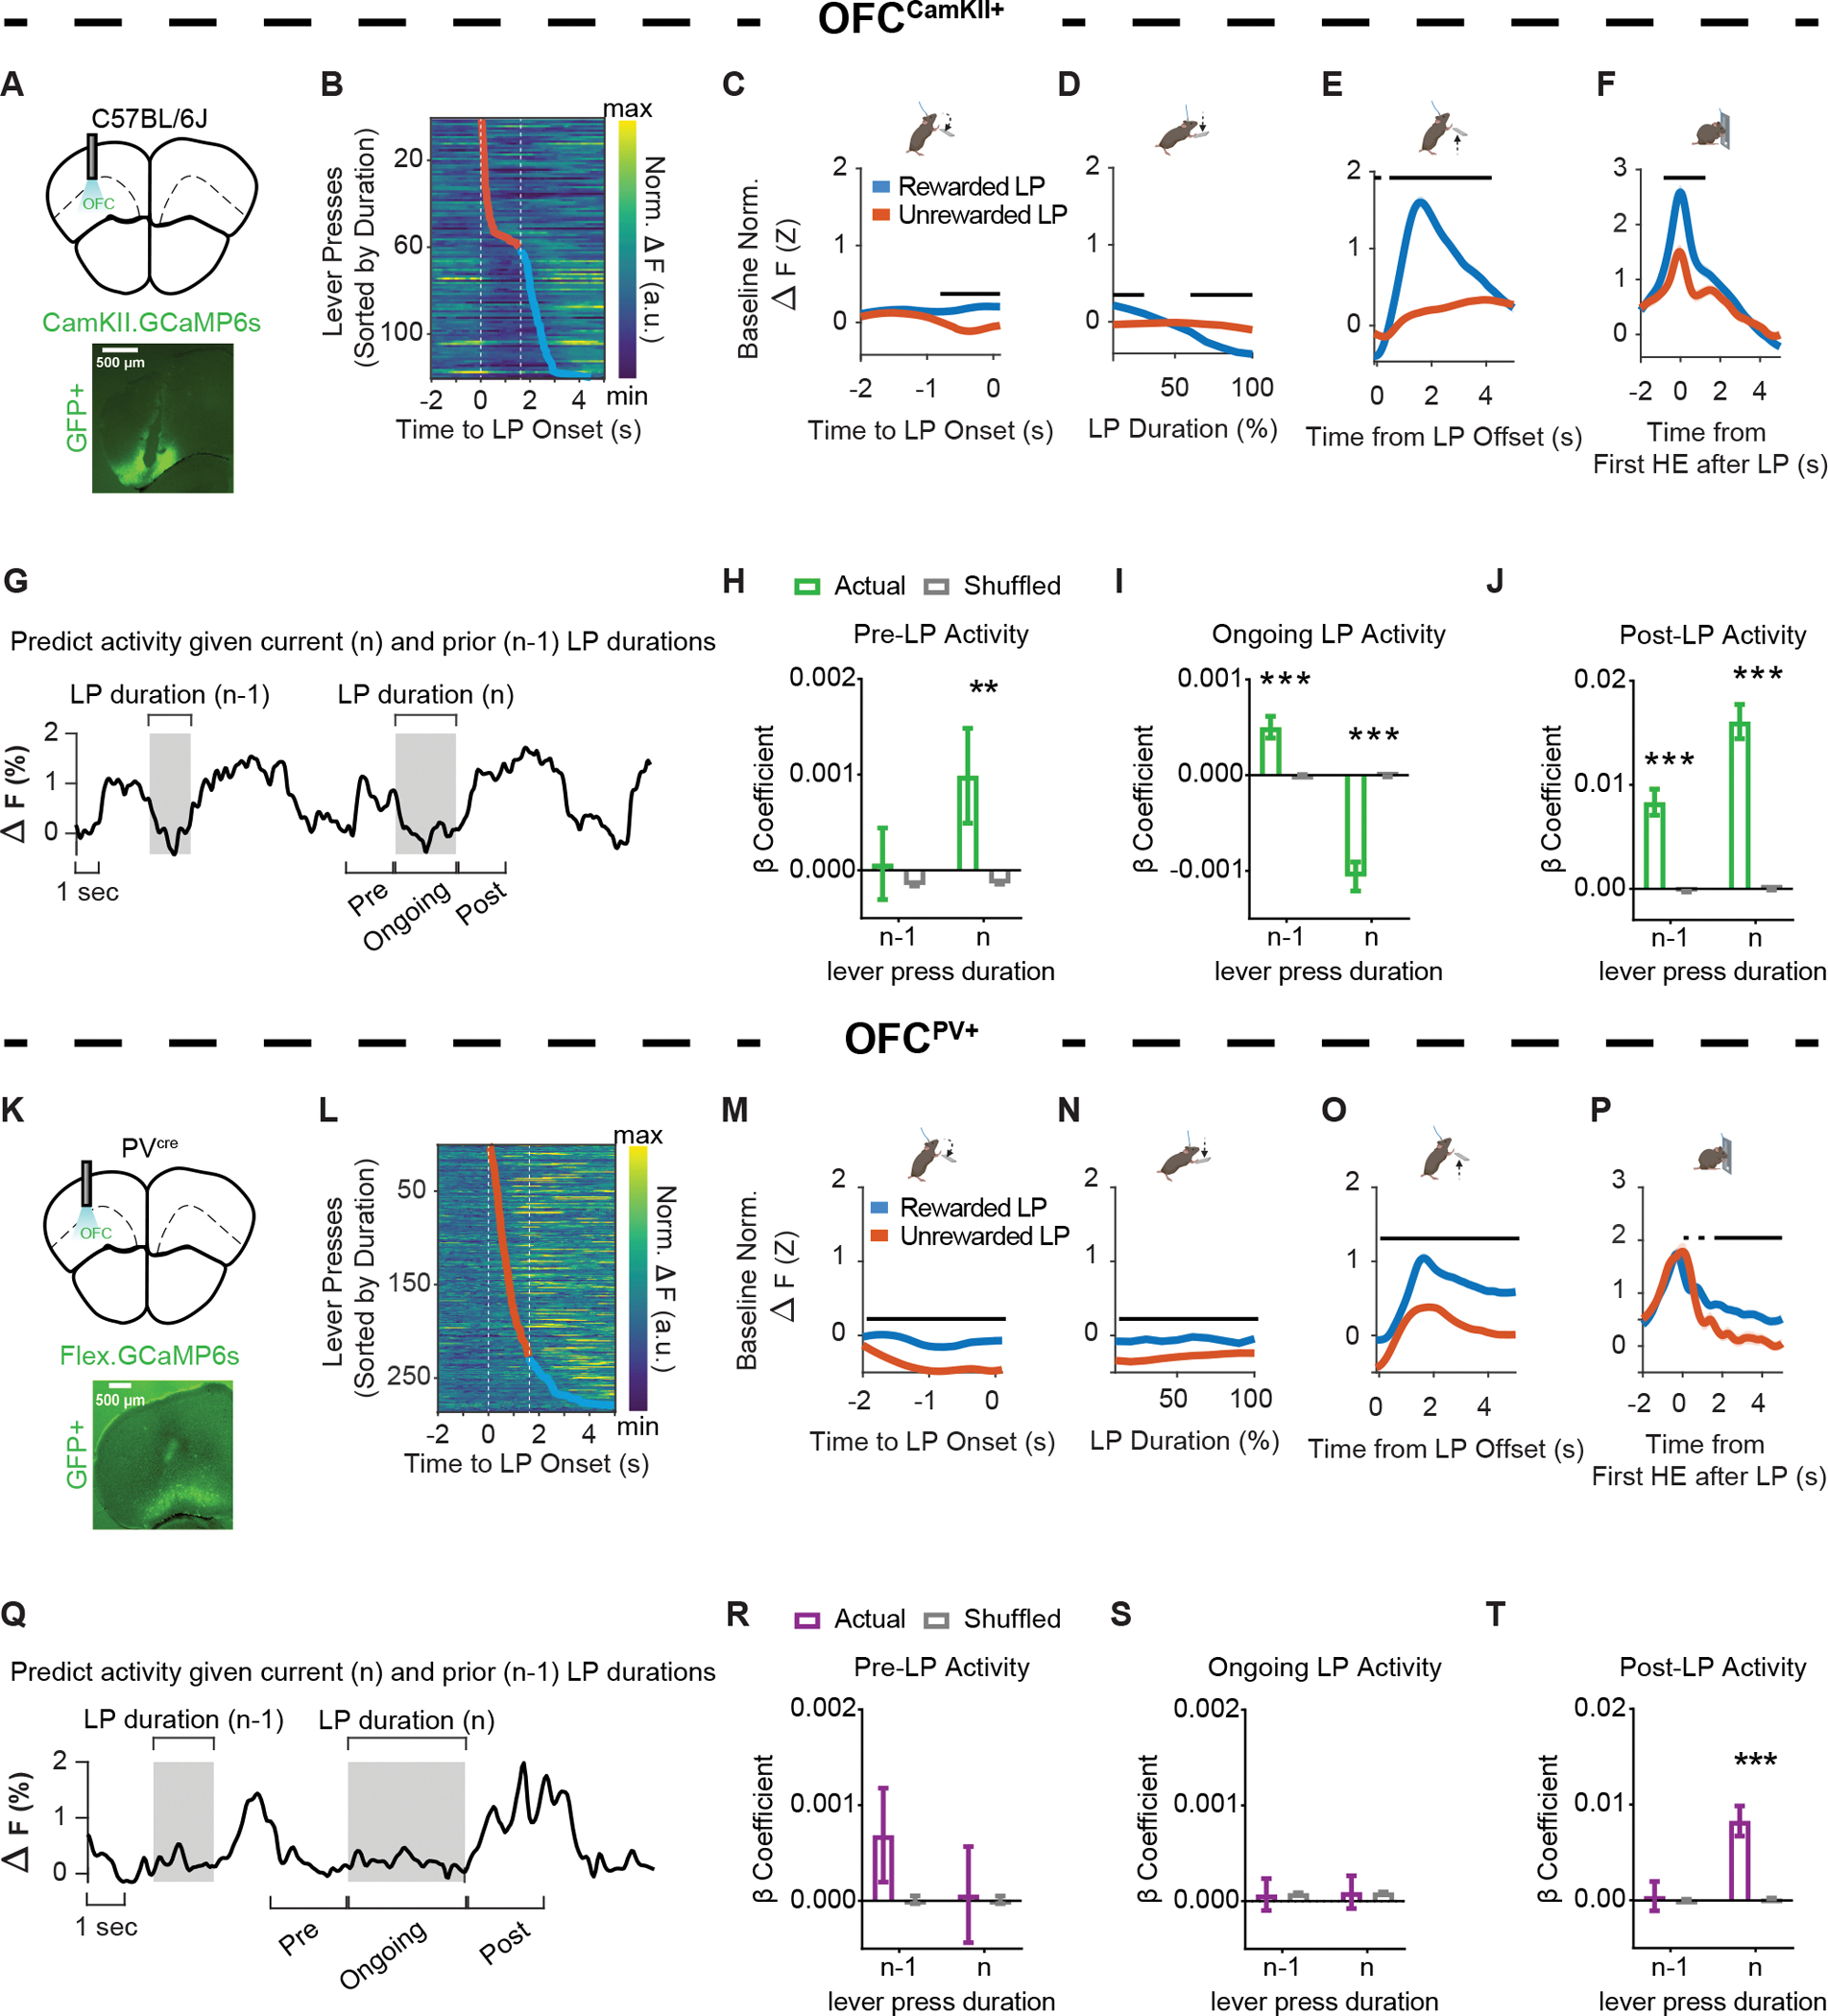
Figure 2. OFCCamKII+, but not OFCPV+, Ca2+ activity encodes prior action information.

(A) (top) Anatomical schematic and (bottom) representative histology of (A) OFCCamKII+ in vivo Ca2+ fiber photometry experiments (C57BL/6J, n = 9 mice, 6 males, 3 females). Approximate bregma coordinate AP +2.68 mm.
(B) Representative data heat map of OFCCamKII+ normalized fluorescence changes relative to lever press initiation, ordered by lever press duration.
(C–F) Ca2+ activity from OFCCamKII+ populations z-scored normalized relative to a pre-lever press onset baseline period and aligned to (C) lever press onset, (D) lever press duration (presented as the relative percentage of total lever press duration), the (E) offset (i.e. termination) of a lever press, and the (F) first head entry made after a lever press.
(G) Representative traces indicating changes in OFCCamKII+ Ca2+ fluorescence over time.
(H–J) β coefficients from LME models relating OFCCamKII+ Ca2+ activity to current and prior durations for actual and order shuffled data (H) before press onset (Pre-LP Activity), (I) during the press (Ongoing LP Activity), and (J) after press offset (Post-LP Activity).
(K) (top) Anatomical schematic and (bottom) representative histology of OFCPV+ in vivo Ca2+ fiber photometry experiments (PVcre, n = 8, 5 males, 3 females). Approximate bregma coordinate AP +2.68 mm.
(L) Representative data heat map of OFCPV+ normalized fluorescence changes relative to lever press initiation, ordered by lever press duration.
(M–P) Ca2+ activity from OFCPV+ populations z-scored normalized relative to a pre-lever press onset baseline period and aligned to (M) lever press onset, (N) lever press duration (presented as the relative percentage of total lever press duration), the (O) offset (i.e. termination) of a lever press, and the (P) first head entry made after a lever press.
(Q) Representative traces indicating changes in OFCPV+ Ca2+ fluorescence over time.
(R–T) β coefficients from LME models relating OFCPV+ Ca2+ activity to current and prior durations for actual and order shuffled data (R) before press onset (Pre-LP Activity), (S) during the press (Ongoing LP Activity), and (T) after press offset (Post-LP Activity).
LP = lever press, HE = Head Entry. Black lines in C–F and M–P indicate significant differences between Rewarded and Unrewarded lever presses via permutation testing (p < 0.05). For B and L, dashed white lines indicate 1600 ms session criterion window. Orange markers indicate the termination of an unrewarded lever press. Blue markers indicate the termination of rewarded lever press. For G and Q, shaded regions indicate the duration of the current (n) or prior (n − 1) lever press. Ca2+ activity magnitude predicted by LME models includes −2s to 0s before (Pre), during (Ongoing), or 0 to 2s after (Post) the current lever press.
Shuffled data are the mean ± SEM of 1000 order shuffled β coefficients. ** p < 0.01, *** p < 0.001.
For a full report of permutation testing p-values related to Figures 2C–F and 2M–P, see publicly available data listed in the key resources table.
