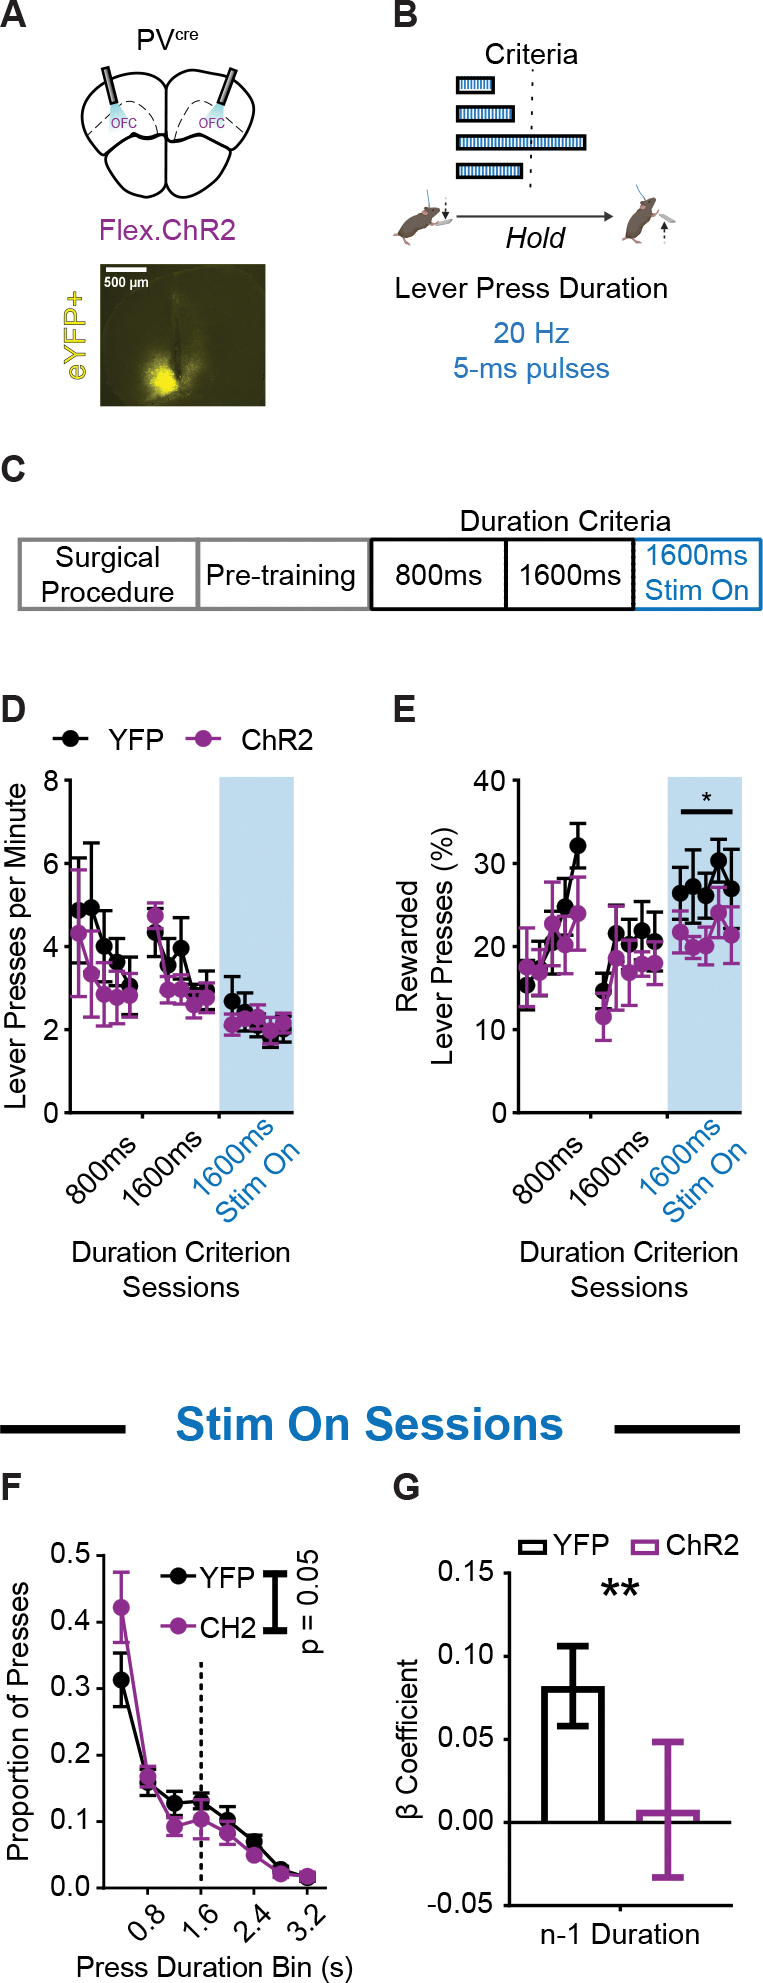
Figure 3. Optogenetic excitation of OFCPV+ populations during action execution reduces rewarded performance and use of prior action information.

(A) (top) Schematic and (bottom) example histology of ChR2 optogenetic excitation of OFCPV+ neurons (PVcre ; n = 6 ChR2, 5 males, 1 female; n = 8 YFP, 5 males, 3 females). Approximate bregma coordinate AP +2.68 mm.
(B) Behavior schematic demonstrating how 470 nm light delivery (20 Hz, 5 ms pulses) occurred for the duration of every lever press made.
(C) Training schedule for optogenetic experiments. Pretraining sessions were followed by sessions with a minimum duration criterion. Sessions in which light was delivered occurred thereafter.
(D and E) Lever pressing rate (D) and (E) percentage of lever presses that exceeded the duration criterion across sessions. Blue shaded region indicates the sessions in which light was delivered. (F) Histogram of lever press durations (400 ms bins) averaged for all 1600 ms duration criterion sessions during which light was delivered.
(G) β coefficients of LME model relating current lever press duration (n) to prior (n − 1) press durations for YFP and ChR2 cohort actual data. Significance marker indicates comparisons to 1000 group shuffled data. 800 ms and 1600 ms refer to days where the criterion was >800 ms or >1600 ms. 1600 ms Stim On refers to days where criterion was >1600 ms and light was delivered.
Data points represent mean ± SEM. *p < 0.05, **p < 0.01.
See also Table S4 for more data.
