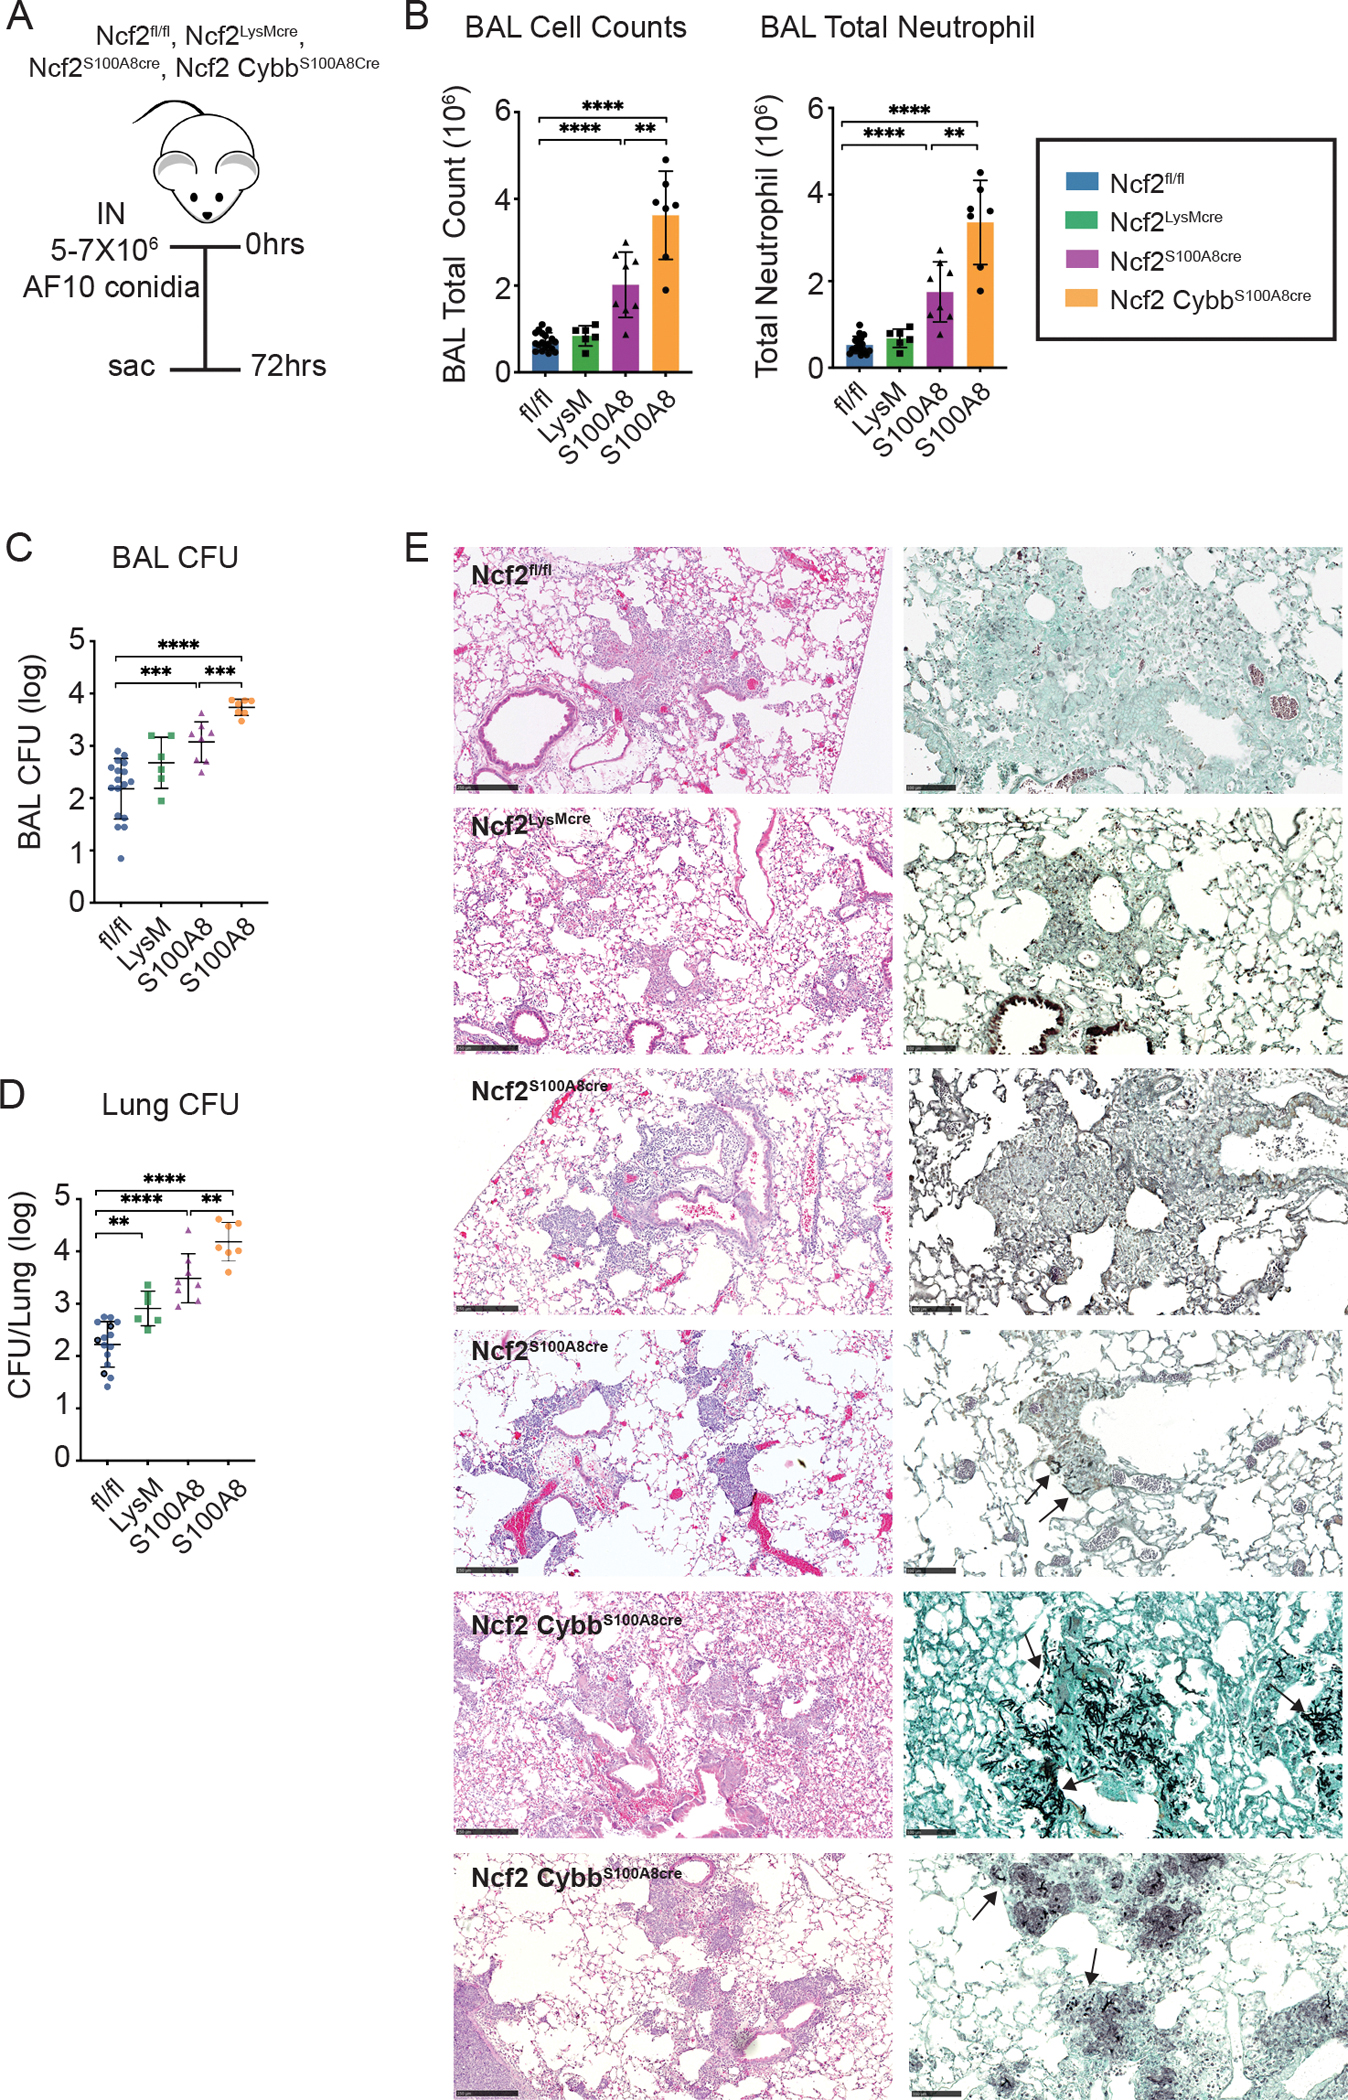
Figure 4. Reduced NOX2 activity in neutrophils increases A. fumigatus burden following challenge with AF10 conidia.

a) Schema for AF10 challenge in Ncf2fl/fl, Ncf2LysMCre, Ncf2S100A8Cre and Ncf2CybbS100A8Cre mice, with analysis at 72 hpi. B) Total leukocyte and neutrophil counts from 1 ml BAL fluid. (C, D) Aspergillus CFU in 1 ml BAL fluid (C) and in homogenate of right lung (D) for the indicated mice. (E). Representative histology of lung sections for the indicated genotypes. From left to right, panels show H&E (bar 250 μm), and GMS (bar 100 μm). Arrows indicate hyphae. Data represents 2 – 4 independent sets of experiments with n≥4 per group. Graphical data shown as mean ± SD. Student’s ‘t’ test was performed for comparisons between 2 groups and *P<0.05, **P<0.01, ***P<0.001 ****P< 0.0001 were considered as significant.
