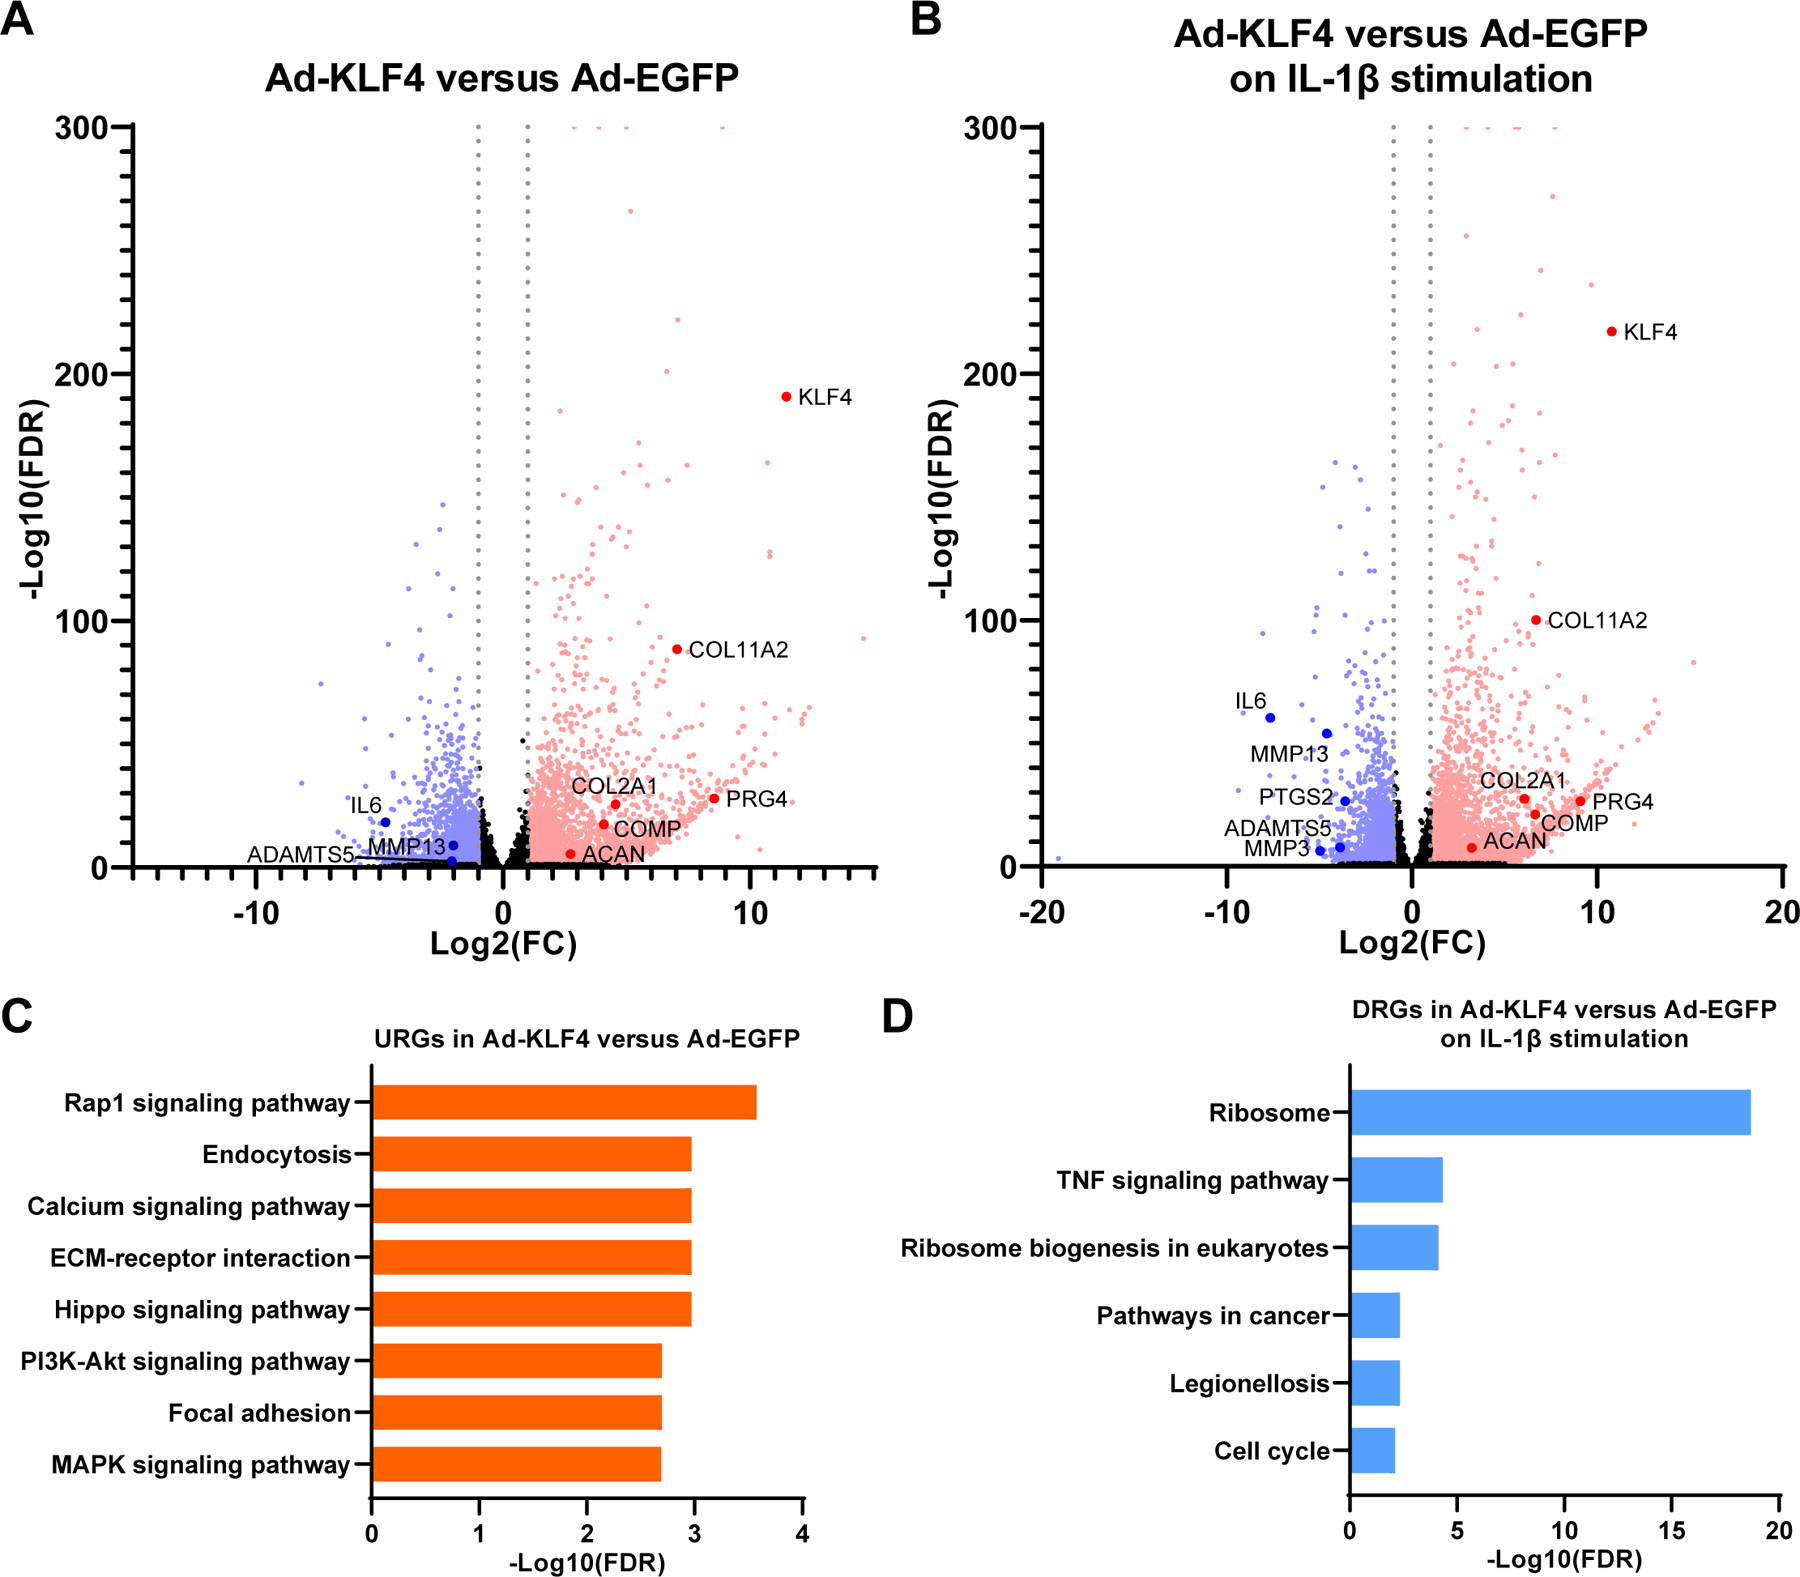
Figure 6. Digital RNA with pertUrbation of Genes (DRUG-seq) analysis of Ad-EGFP or Ad-KLF4 transfected TC28a2 cells.

In samples with IL-1β stimulation, cells were treated with 10 ng/ml of IL-1β for 6 hours before RNA collection. n=7 per condition from seven independent experiments were analyzed. (A) Volcano plot analysis to identify differentially expressed genes (DEGs) in Ad-KLF4 versus Ad-EGFP transfected samples. (B) Volcano plot analysis to identify DEGs in Ad-KLF4 versus Ad-EGFP transfected samples on IL-1β stimulation. For (A and B), grey dotted lines indicate |log2(fold change [FC])|=1. Significantly upregulated genes (URGs) are shown as red dots, while significantly down-regulated genes (DRGs) are indicated as blue dots; black dots represent non-significant DEGs. (C) Kyoto Encyclopedia of Genes and Genomes (KEGG) pathway analysis for URGs in Ad-KLF4 versus Ad-EGFP transfected samples. The top eight enriched pathways are shown. (D) KEGG pathway analysis for DRGs in Ad-KLF4 versus Ad-EGFP transfected samples on IL-1β stimulation. All significantly enriched pathways are shown. FDR, false discovery rate.
