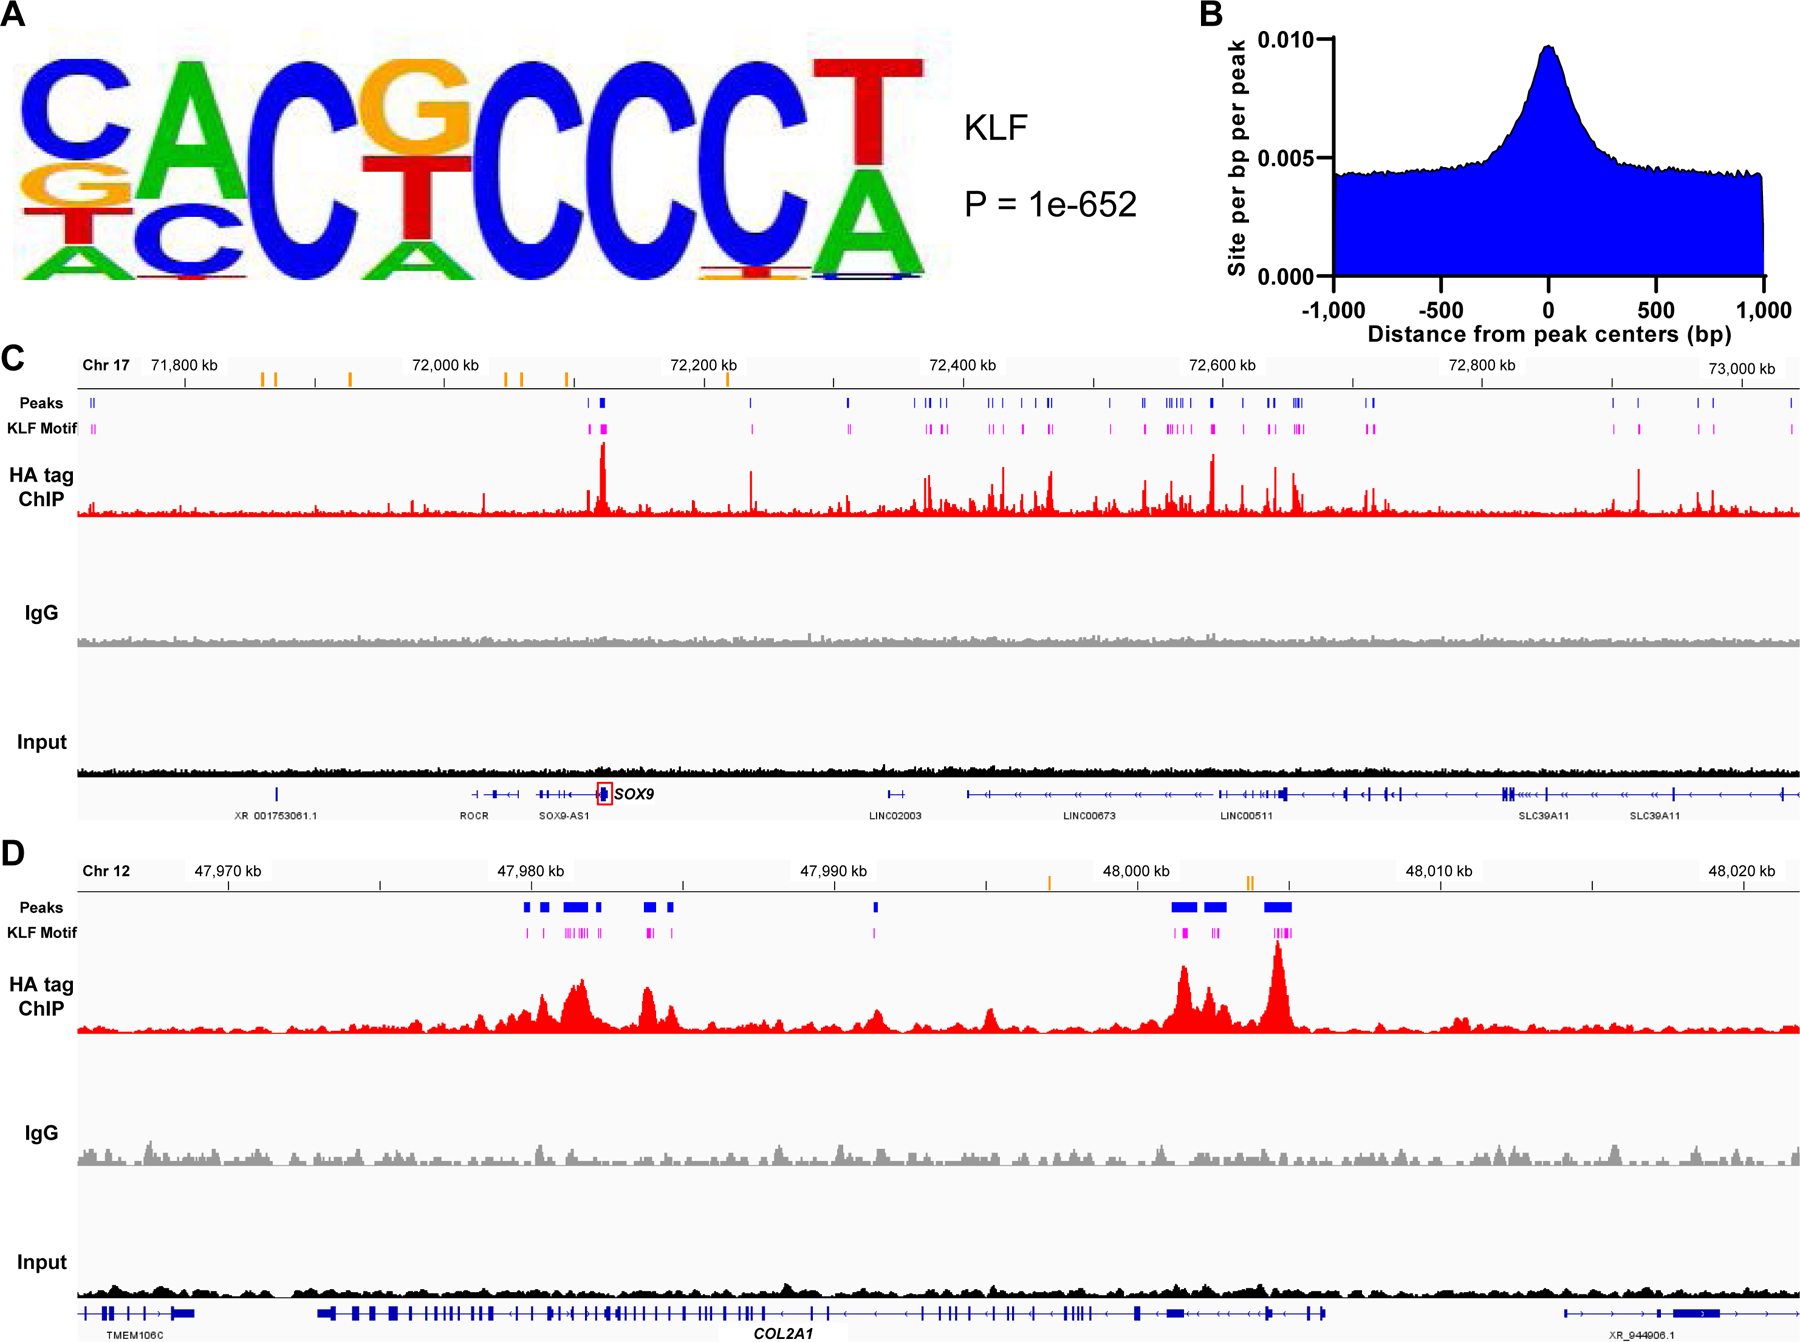
Figure 7. Chromatin immunoprecipitation sequencing (ChIP-seq) for genome-wide analysis of KLF4-DNA association in KLF4 overexpressed TC28a2 cells.

(A) A KLF motif recovered from ChIP-seq peaks. The motif logo displays nucleotide frequencies (scaled relative to the information content) at each position. (B) Distribution of the KLF motif within a 1,000 base pair (bp) window from the peak centers with a 10 bp step size. (C and D) Visualization of aligned reads for HA tag ChIP-seq, IgG and input samples around the SOX9 gene (C) and around the COL2A1 gene (D). Orange bars indicate previously identified enhancers for each gene. Blue bars indicate peak regions that were putative regulatory domains of SOX9 or COL2A1 and common between the replicates of ChIP samples. Pink bars show the predicted sites of the recovered KLF motif which were located within the peak regions. Chr, chromosome. kb, kilobase.
