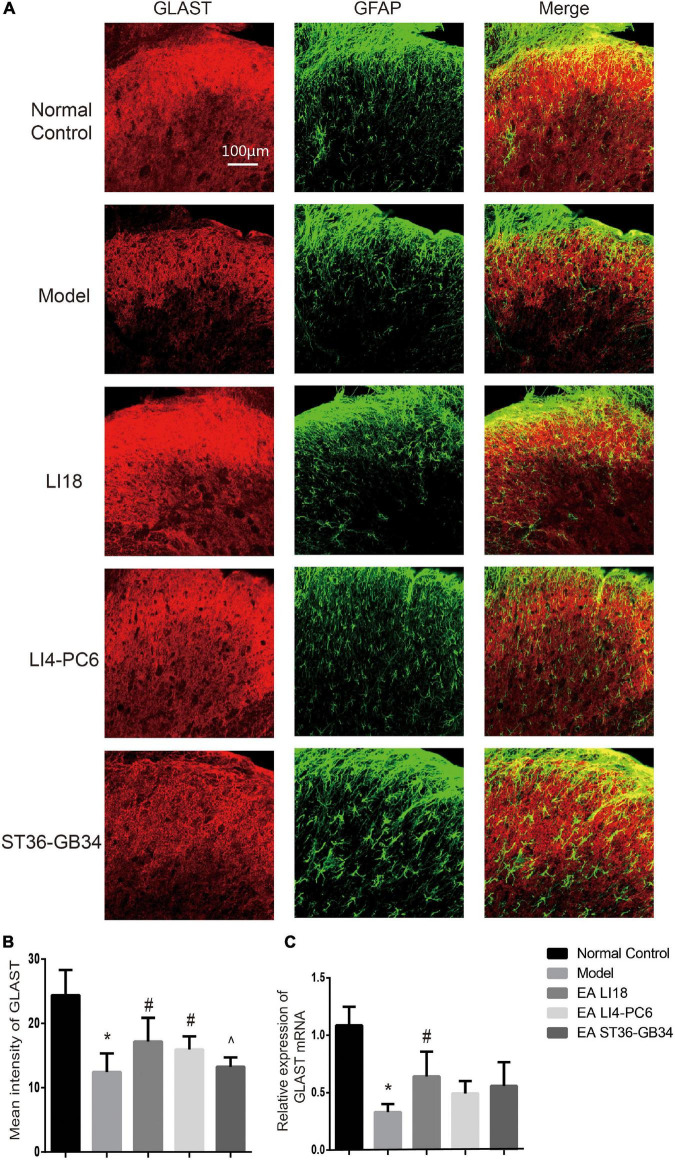
FIGURE 7.
Comparison of expression of glu aspartate transporter (GLAST) in different groups (mean ± SD, n = 6/group). (A) Fluorescence micrographs of immunohistochemistry staining showing the co-expression (yellow) of GLAST (red) and glial fibrillary acidic protein (GFAP) (green) in the cervical spinal cord dorsal horns (DHs) at 24 h after neck incision. The scale bar is 100 μm. (B) Bar graphs showing the mean fluorescence intensity of GLAST in the five groups. The expression of GLAST protein was reduced in the model group relevant to the control group. After electroacupuncture (EA), the expression level of GLAST protein was significantly upregulated in both EA LI18 and EA PC6-LI4 groups but not in the EA ST36-GB32 group. (C) Bar graphs showing the relative expression of GLAST mRNA in the five groups. The expression of GLAST mRNA was significantly downregulated in the model group (vs. the control group) and significantly increased in EA LI18 group, rather than in the EA PC6-LI4 and EA ST36-GB34 groups (vs. the model group). *P < 0.01, vs. the control group, #P < 0.05, vs. the model group, ^P < 0.05, vs. the EA LI18 group.

