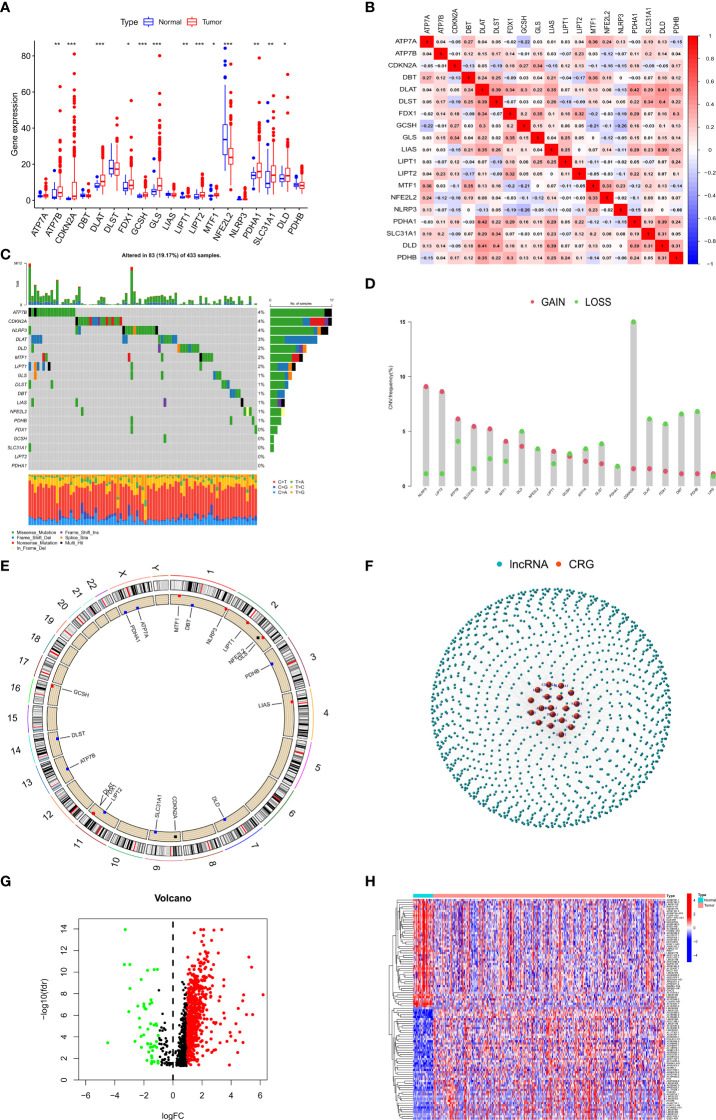
Figure 1.
Landscape of CRGs and identification of CRLs in GC patients. (A) The expression of 19 CRGs in GC and normal tissues. (B) Correlation analysis of 19 CRGs. (C) The mutation frequency of 19 CRGs in STAD. (D) The CNV variation frequency of 19 CRGs in STAD. (E) The location of CNV alteration of 19 CRGs on 23 chromosomes in STAD. (F) Gene coexpression network map of CRGs and lncRNAs. (G) Volcano plot shows differentially expressed CRLs. (H) Heatmap showed the top 50 differentially expressed CRLs. *p < 0.05, **p < 0.01, and ***p < 0.001.

