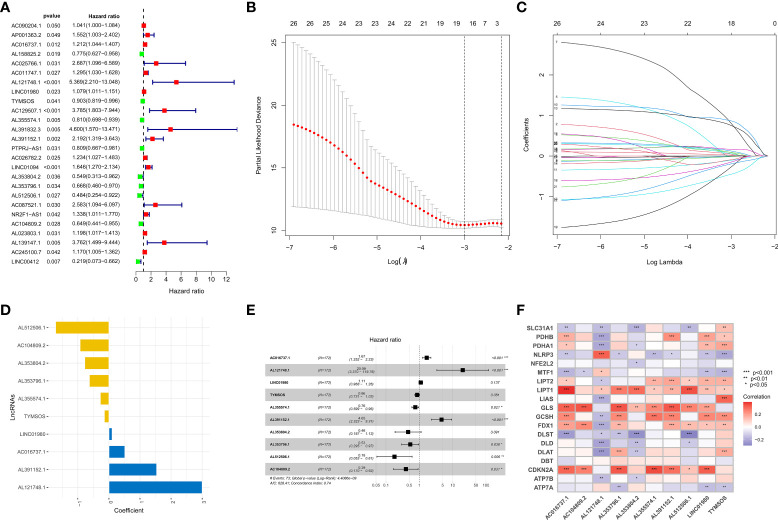
Figure 2.
Establishment of the risk model. (A) Forest plot of 26 prognosis-related lncRNAs after univariate Cox regression analysis (p < 0.05). (B, C) LASSO regression of 26 prognosis-related lncRNAs. (D, E) The HR and coefficient of 10 CRLs involved in the multivariate Cox proportional hazards model. (F) The correlation between 19 CRGs and 10 CRLs in the risk model was visualized. *p < 0.05, **p < 0.01, and ***p < 0.001.

