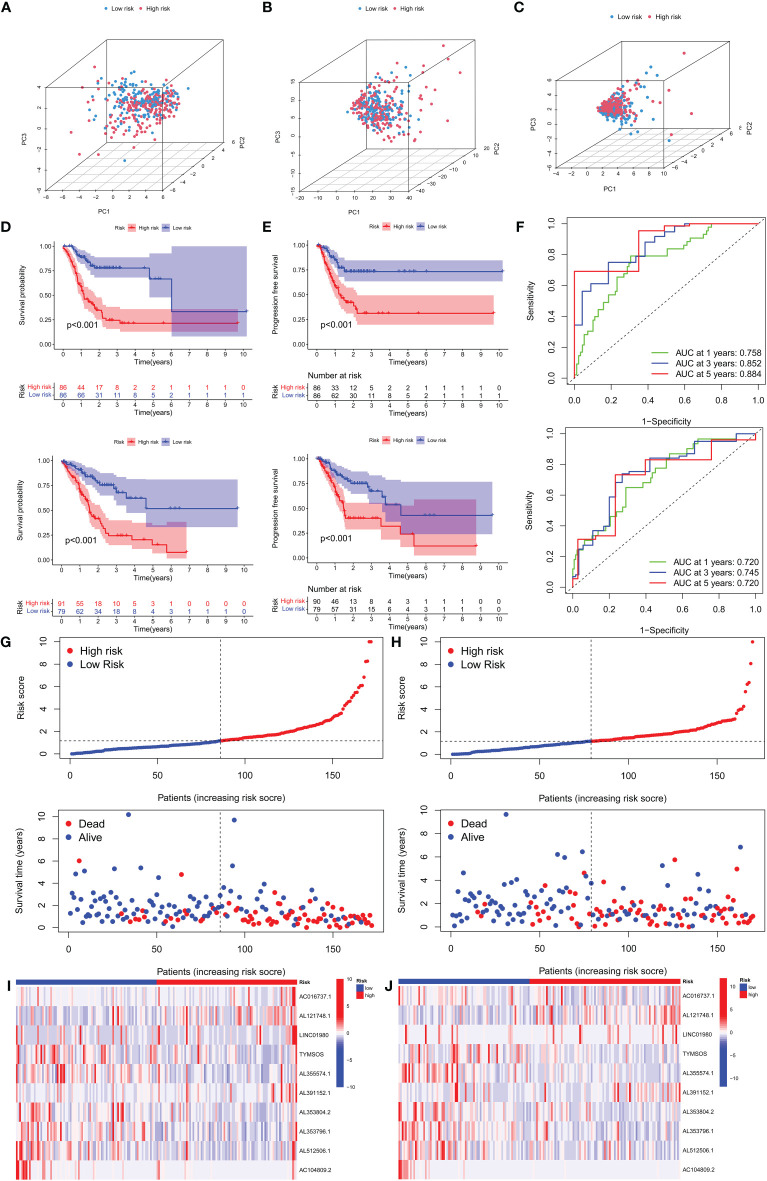
Figure 3.
Survival analysis and validation of the risk model in the training set and testing set. (A) PCA analysis was conducted for the entire gene set, (B) 19 CRGs, and (C) 10 CRLs in the risk model. (D, E) The survival difference of patients with different risk patterns in the training set and testing set. (F) A time-dependent ROC curve was plotted to test the accuracy of the risk model. (G, H) Patients in the training set and testing set were ranked according to the risk score. Then, the survival status difference of the patients between the two groups was visualized. (I, J) Heatmap showed the RNA level of the 10 CRLs in the training set and testing set.

