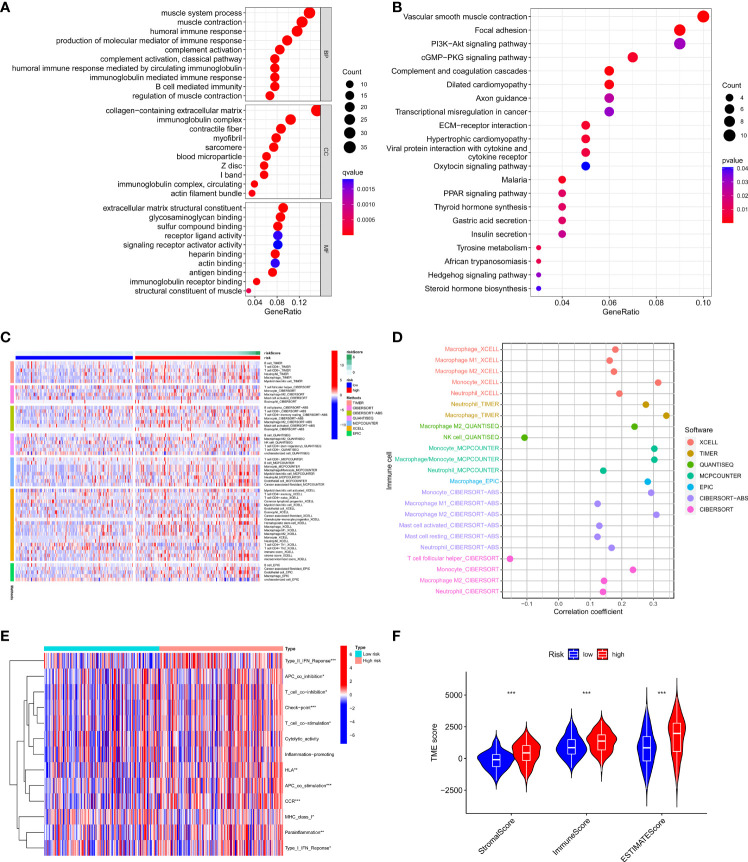
Figure 6.
Relationship between the risk model and tumor immune microenvironment. (A, B) GO, and KEGG analysis of differentially expressed genes between high-risk and low-risk groups. (C, D) The infiltration status of immune cells of patients with different risk patterns. (E) Immune function differences of patients with different risk patterns. (F) The score of tumor immune microenvironment in different risk groups. *p < 0.05, **p < 0.01, and ***p < 0.001.

