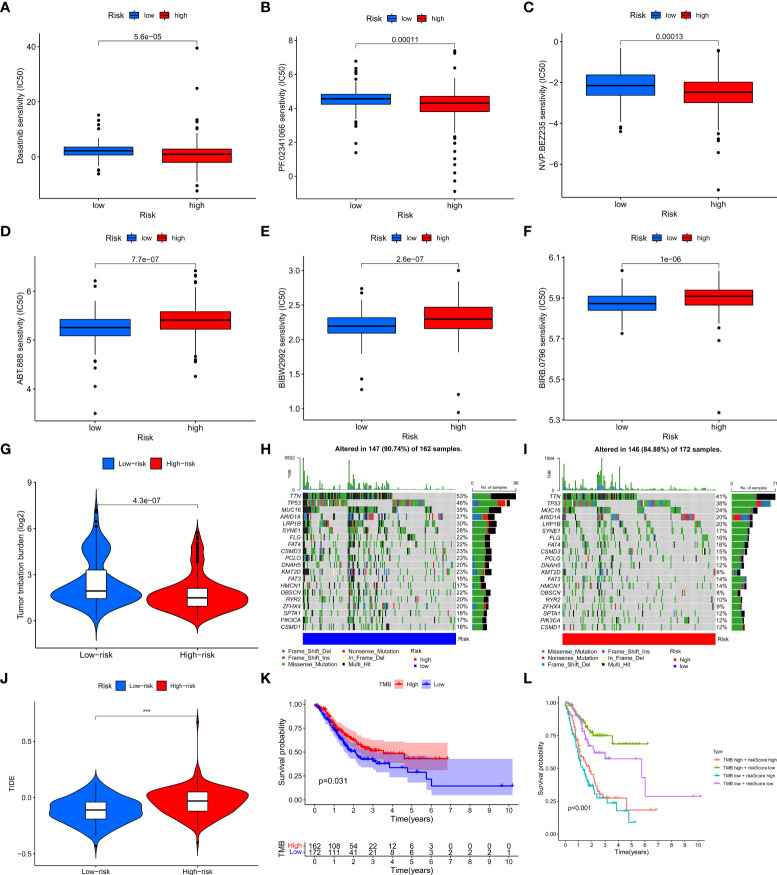
Figure 7.
The relationship between the risk model and immunotherapy or TMB. (A–F) Drug sensitivity of patients with different risk patterns. (G) The relationship between risk score value and TMB level. (H, I) TMB status of the top 20 genes was visualized in two groups. (J) TIDE score of patients in two risk groups. (K) The survival outcome of the patients with different TMB levels. (L) The prognosis of patients with different tumor mutation burdens and different risk patterns was accessed. ***p < 0.001.

