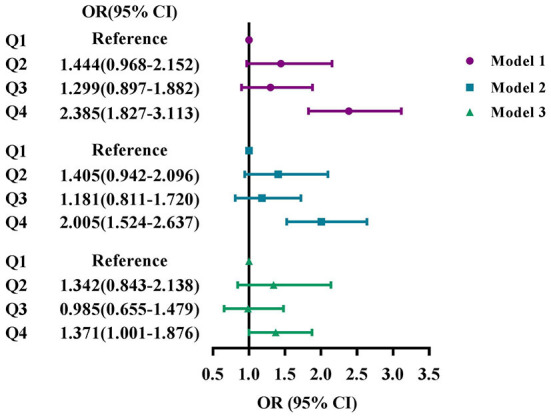
Figure 2.

Associations of serum osmolarity with DR, NHANES 2005–2008. (A) Model 1: Unadjusted. (B) Model 2: Adjusted for age, sex, and race. (C) Model 3: Adjusted for age, sex, race, education, marital status, BMI, smoke status, alcohol consumption, blood glycohemoglobin, serum total cholesterol, serum albumin, comorbidities, use of diuretics, and ophthalmic imaging status. Q1, the lowest osmolality group (serum osmolality ≤ 275 mOsm/kg); Q2, the lower osmolality group (276–279 mOsm/kg); Q3, the higher osmolality group (280–282 mOsm/kg); Q4, the highest osmolality group (≥ 283 mOsm/kg).
