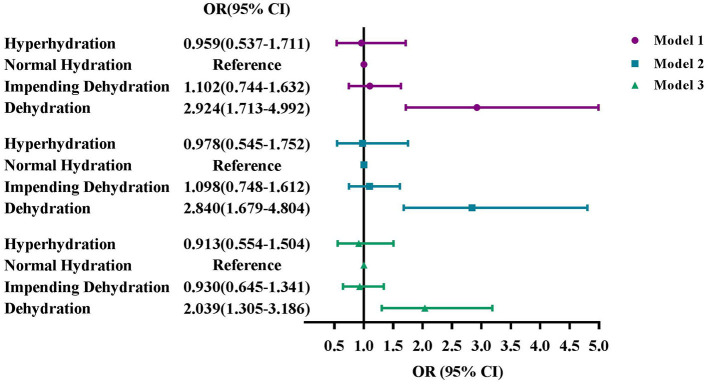
Figure 4.
Associations of hydration status by calculated osmolarity with DR in older adults, NHANES 2005-2008. (A) Model 1: Unadjusted. (B) Model 2: Adjusted for age, sex, and race. (C) Model 3: Adjusted for age, sex, race, education, marital status, BMI, smoke status, alcohol consumption, blood glycohemoglobin, serum total cholesterol, serum albumin, comorbidities, use of diuretics, and ophthalmic imaging status.

