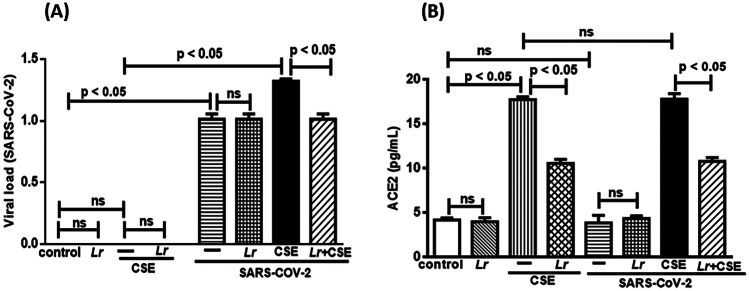
Fig. 3.
Lactobacillus rhamnosus on viral load and ACE2 level. Viral charge (A) and ACE2 concentration (B) in 16HBE cells treated with Lr (1 × 10⁶ CFU) for 2 h, and then exposed to CSE (2.5%) associated to SARS-CoV-2 (MOI: 0.1) during 20 h. The viral load of SARS-CoV-2 was measured by real-time polymerase chain reaction (PCR), and the ACE2 level was detected using an ELISA kit for humans. Data are presented as means ± SE from triplicate samples for each treatment versus control. ns, non-significant difference

