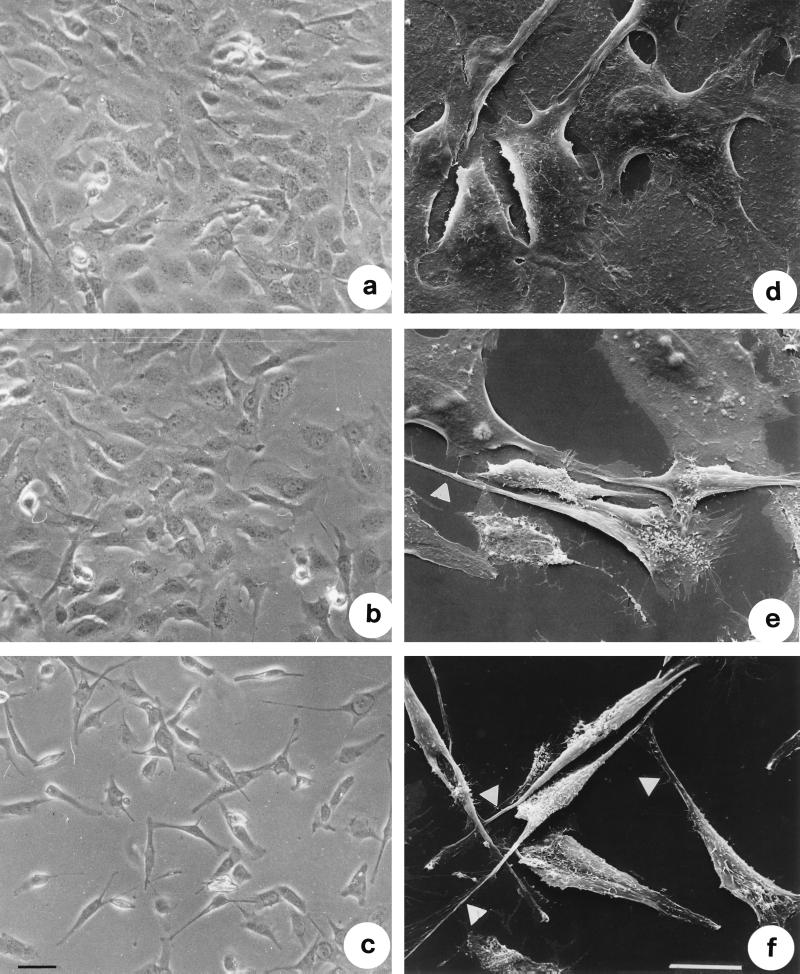
FIG. 3.
TDH induces morphological effects in IEC-6 cells. Shown are phase-contrast images of control cells (a) and cells treated with 2.5 HU of TDH per ml for 2 (b) and 18 (c) h and scanning electron micrographs of control cells (d) and cells exposed to 2.5 HU of TDH per ml for 2 (e) and 18 (f) h all at the same magnification. Note the extrusion of thin filopodia from the cell body of cells exposed to the hemolysin (arrows). Bars represent 10 μm.

