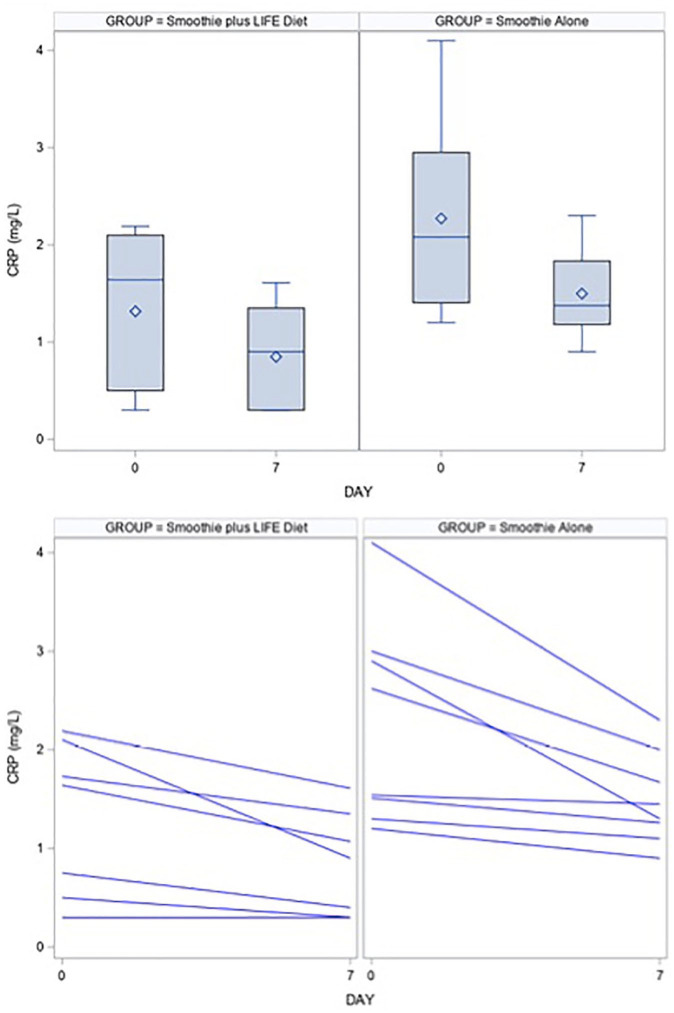
Figure 1.
Boxplots and line plots for the distribution of C-reactive protein (CRP) at baseline and day 7 in the LIFE diet and smoothie groups. For the purposes of maintaining the scale of the graph, we excluded one outlier in the smoothie group. Statistical analysis was performed using a 2-sample t test.

