Figure 1.
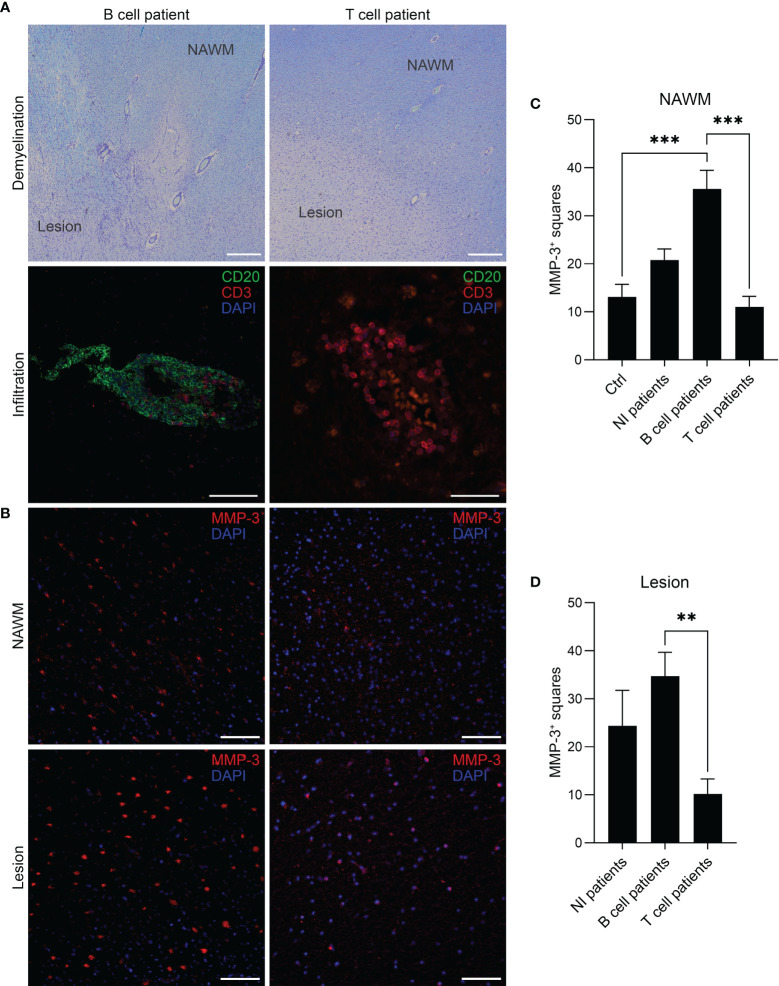
MMP-3 expression in MS brain tissue of different patient groups. (A) Representative images of a patient in the “B cell” and “T cell” group. Lesions and NAWM were determined by visualizing demyelinated and myelinated areas based on a Klüver-Barrera staining. Scale bars represent 500 µm. The B cell patient was characterized by the presence of both CD20+ B cells and CD3+ T cells, while the T cell patient showed infiltration of CD3+ T cells only. Scale bars represent 100 µm and 50 µm, respectively. (B) The images show MMP-3 expression in the same B cell and T cell patient (as shown in A) comparing lesion and NAWM. Scale bars represent 50 µm. (C, D) Quantification of MMP-3 expression in (C) NAWM and (D) lesion in different patient groups. The graph shows the number of squares containing MMP3+ cells by using an overlying grid. Bar graphs represent mean values + SEM. **p < 0.01, and ***p < 0.001; one-way ANOVA. NAWM, normal appearing white matter; NI, no CD3/CD20 infiltration.

