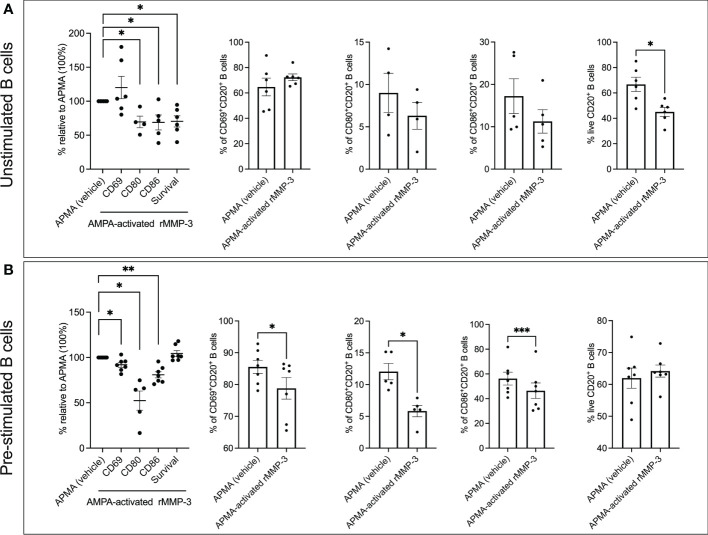
Figure 3.
Analysis of activation markers and survival of B cells after MMP-3 stimulation. (A) Expression of CD69, CD80 and CD86 and viability of unstimulated (cells isolated from n = 4 – 6 healthy donors) B cells after treatment with APMA-activated rMMP-3 compared to APMA (vehicle) only. (B) Expression of CD69, CD80 and CD86 and viability of pre-stimulated (cells isolated from n = 5-7 healthy donors) B cells incubated with APMA-activated rMMP3 or APMA (vehicle) only. Relative expression of CD69, CD80 and CD86 and viability of either unstimulated (A) or pre-stimulated B cells (B) after treatment with rMMP-3 compared to vehicle is also shown. Graphs show mean values + SEM. *p < 0.05, **p < 0.01, ***p < 0.001; paired t test, Wilcoxon test. APMA, 4-aminophenylmercuric acetate.

