Figure 4.
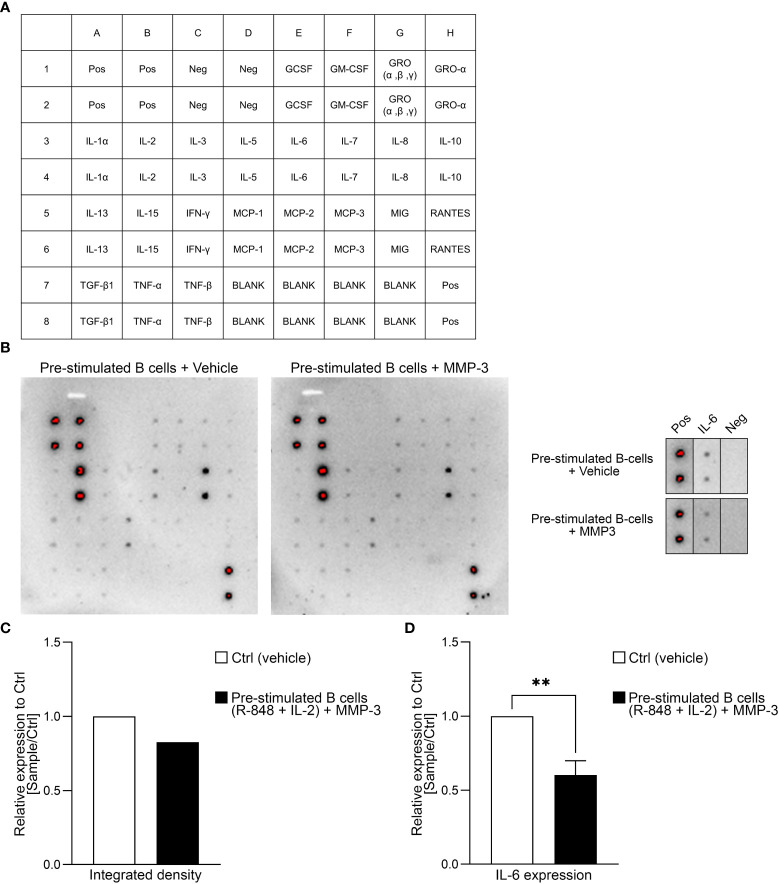
Cytokine profiling of MMP3-treated B cells. (A) Layout of the antibody array used for investigating cytokines. (B) The dot blot indicates the cytokine expression profile of pre-stimulated B cells after treatment with either MMP-3 or vehicle from one representative donor. Additionally, IL-6 production by B cells from the same donor is highlighted. (C) Relative amount of IL-6 production by pre-stimulated B cells treated with MMP-3 compared to vehicle was calculated by using integrated density from n = 1 donor, measured in duplicates. (D) Relative IL-6 production of pre-stimulated B cells (n = 9 healthy donors), measured by ELISA. Bars display mean values + SEM, **p < 0.01, paired t test. Pos, positive control; Neg, negative control.

