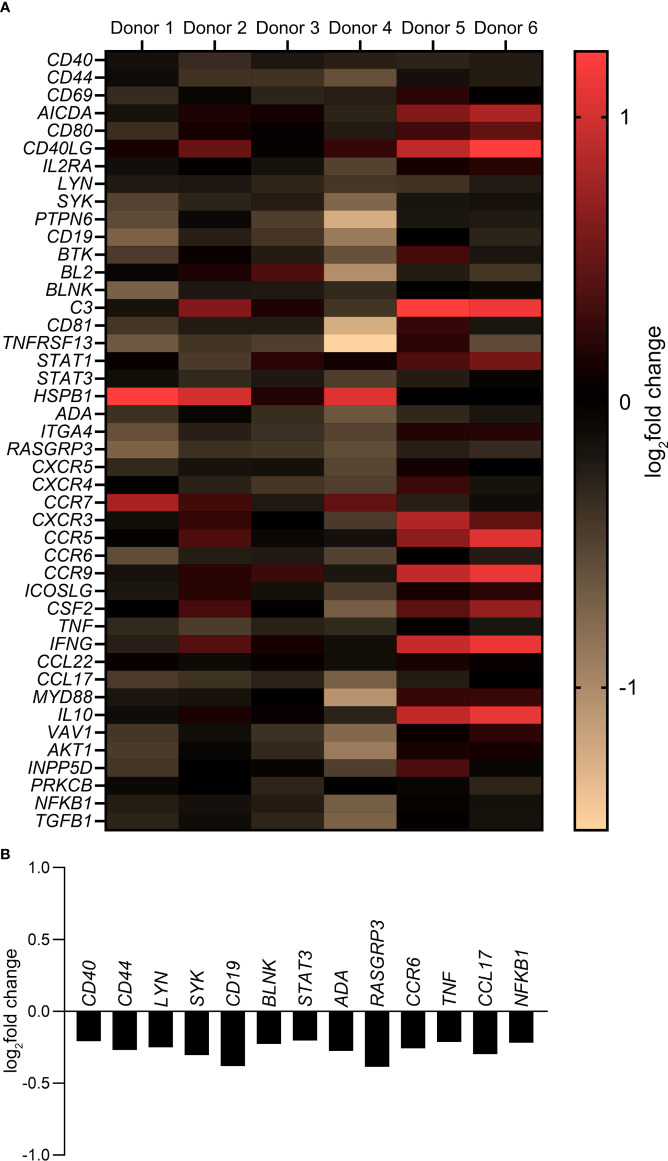
Figure 5.
Gene expression profile of B cells after treatment with MMP-3. (A) Expression of B cell-related genes by pre-stimulated B cells treated with activated rMMP-3 relative to APMA in different donors (n = 6). B cells from 8 – 10 wells/condition/donor were pooled and measurements were done in duplicates. Values show the log2fold change. (B) The graph represents the log2fold change of significantly downregulated genes after MMP-3 treatment compared to the vehicle-treated group (p < 0.05) using paired t test.

