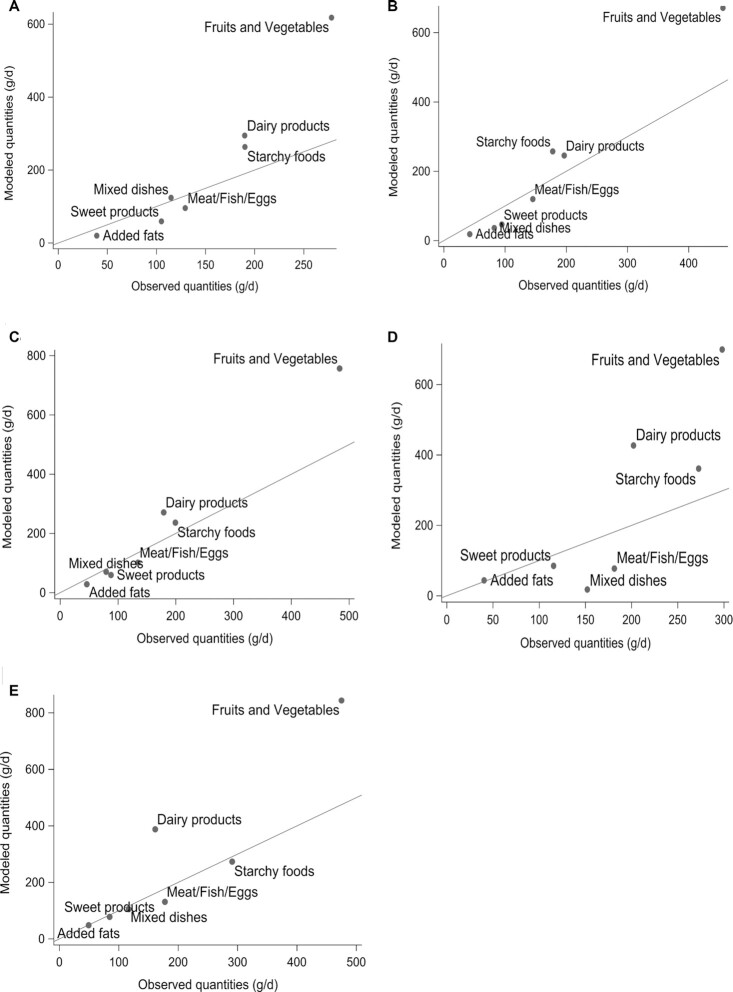
FIGURE 3.
Observed (x-axis) and modeled (y-axis) quantities from selected MOD2 diets of each food group for each subpopulation. For (A) women < 50 y and (C) women ≥ 65 y, the MOD2 selected diets contained animal proteins as 55% of total proteins; for (B) women 50–64 y, the MOD2 selected diet contained animal proteins as 50% of total proteins; for (D) men < 65 y, the MOD2 selected diet contained animal proteins as 45% of total proteins; and for (E) men ≥ 65 y, the MOD2 selected diet contained animal proteins as 60% of total proteins. Abbreviation: MOD2, model set #2.

