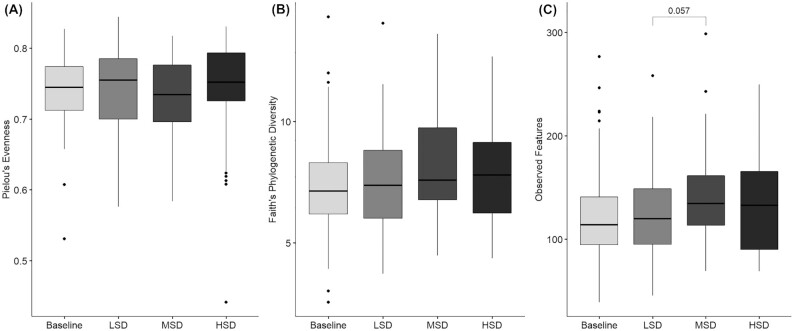
FIGURE 1.
α-diversity values at baseline and following each spice-containing diet based on the following metrics: (A) Pielou's evenness, (B) Faith's phylogenetic diversity, and (C) observed features. Values are presented as median (line), IQR (box), 95% CI (error bars), and outliers (circles). Statistical analyses were performed with SAS version 9.4 (SAS Institute). The mixed models procedure (PROC MIXED) was used to determine the effect of diet on each α-diversity metric. When a main effect was detected, post hoc tests were conducted and adjusted for multiple comparisons using the Tukey–Kramer method. Tukey–Kramer adjusted P values are shown. LSD: n = 44; MSD: n = 52; HSD: n = 47. HSD, high-spice diet; LSD, low-spice diet; MSD, moderate-spice diet.

