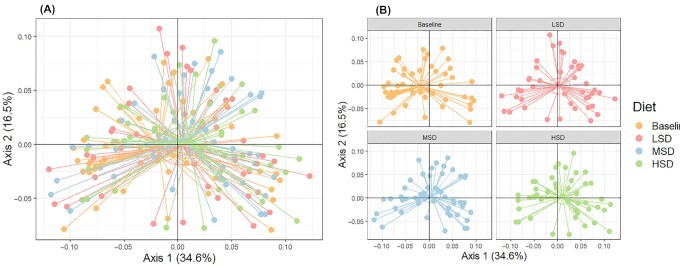
FIGURE 2.
β-diversity assessed by principal coordinate analysis plots based on the weighted UniFrac distance metric (A) overall and (B) separated by diet in participants at risk of CVD. LSD: n = 44; MSD: n = 52; HSD: n = 47. CVD, cardiovascular disease; HSD, high-spice diet; LSD, low-spice diet; MSD, moderate-spice diet.

