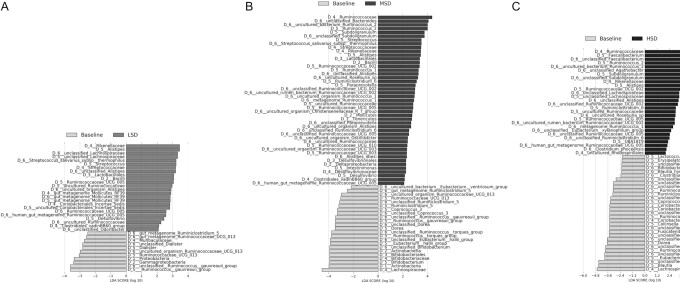
FIGURE 3.
LEfSe enrichment plots display significantly (P ≤ 0.05, LDA ≥ 2) enriched taxa following the (A) LSD, (B) MSD, and (C) HSD when compared with baseline in participants at risk of CVD. LDA scores are displayed on the x-axis and quantify the strength of enrichment within each categorical group. LSD: n = 44; MSD: n = 52; HSD: n = 47. CVD, cardiovascular disease; HSD, high-spice diet; LDA, linear discriminant analysis; LEfSe, linear discriminant analysis effect size; LSD, low-spice diet; MSD, moderate-spice diet.

