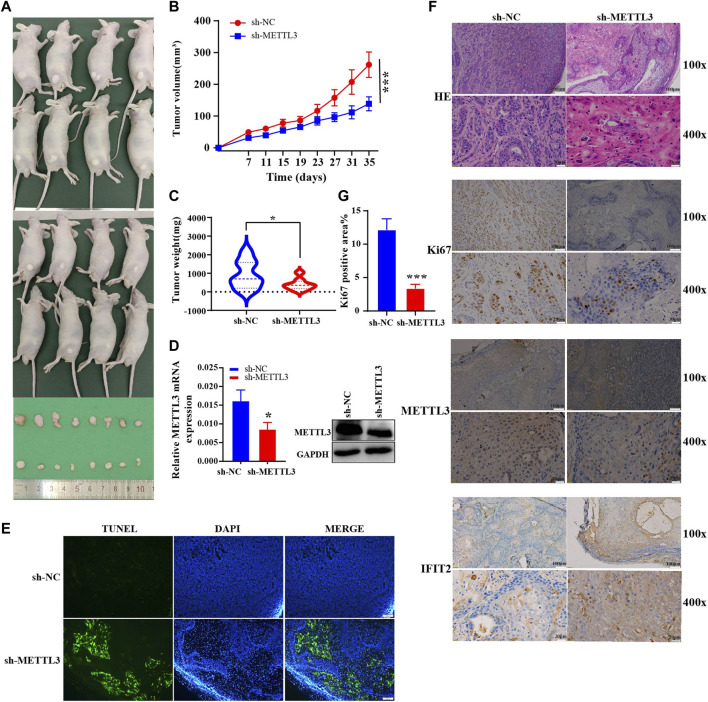
FIGURE 8.
In vivo experimental validations in mice (A). An analysis of the shape of transplanted tumors, changes in body weight of nude mice (B) and growth curves of tumor volume for each group (C) (n = 8). (D). Expression of mouse tumor protein and mRNA. (E). TUNEL staining of the paraffin sections of the xenograft tumors. Evaluation of tumor cell apoptosis by TUNEL staining (scale bar = 100 μm). (F). Ki67 expression and HE coloration in mouse tumor tissue. Immunohistochemical recovery of the expression of METTL3 and IFIT2 (Scale bars are indicated in the figure). (G). The ratio of KI67-positive area in the sh-NC and sh-METTL3 groups was analyzed using ImageJ software. *p < 0.05, ***p < 0.001.

