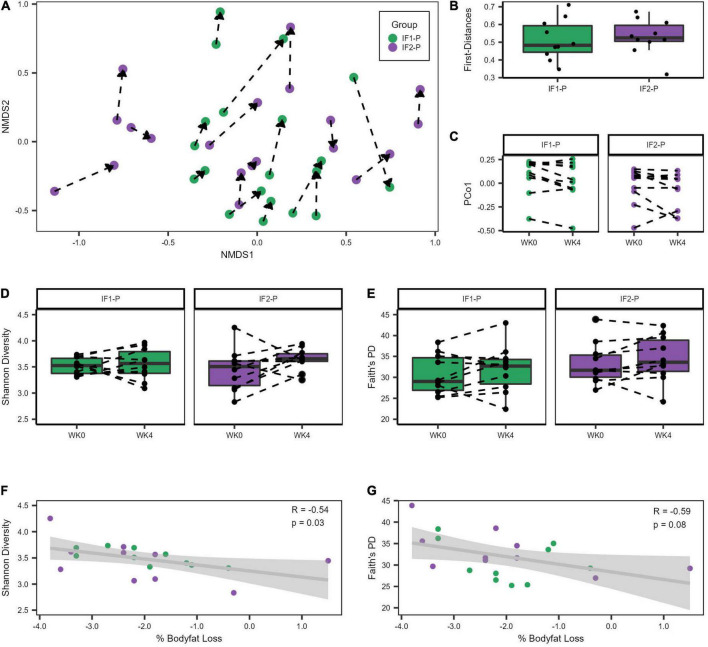
FIGURE 2.
Variation in gut microbiome diversity metrics at baseline and week four of IF1-P and IF2-P participants. (A) Non-metric multidimensional scaling (NMDS) ordination of Bray-Curtis dissimilarity matrix. The GM of both IF1-P (n = 10) and IF2-P (n = 10) groups shifted significantly from baseline to week four (R2 = 0.042, p < 0.001), but there was no difference between groups by time (R2 = 0.009, p = 0.823). The same participant is connected by a dotted line, starting at baseline and the arrow pointing to the end of the intervention period. (B) The first distances of the Bray-Curtis dissimilarities between IF1-P and IF2-P were not significant (p = 0.579). Boxes denote the interquartile range (IQR) between the first and third quartiles, and the horizontal line defines the median. (C) First principal coordinate (PCo1) values differed by time (p = 0.013), with no differences between groups over time detected (p = 0.473). (D) Shannon diversity index did not change significantly over time for IF1-P and IF2-P groups (p ≥ 0.341). (E) Faith’s PD diversity index did not change significantly over time for IF1-P and IF2-P groups (p = 0.653). Boxes denote the IQR between the first and third quartiles, and the horizontal line defines the median. A dotted line connects the same participant. (F) Correlation of baseline Shannon Diversity with percent body fat loss from the four-week IF intervention. (G) Correlation of baseline Faith’s phylogenetic diversity (PD) with percent body fat loss from the four-week IF intervention. Both groups were combined for the correlation analyses and are displayed in different colors. The gray cloud around the regression line indicates the 95% confidence interval.

