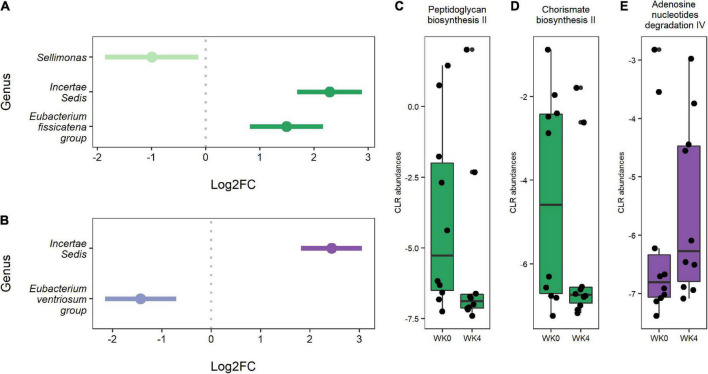
FIGURE 4.
(A) Genera were differentially abundant between baseline and week four for IF1-P participants (n = 10). (B) Genera that were differentially abundant between baseline and week four for IF2-P participants (n = 10). Points represent each genera’s log2 fold change (log2FC; effect size). A positive value indicates that a feature increased in abundance at week four (right), and a negative value indicates a decrease in abundance at week four (left). Bars represent 95% confidence intervals derived from the ANCOM-BC model. Note, the genus Incertae Sedis is from the Ruminococcaceae family. Boxplots displaying statistically significant differences in (C) peptidoglycan biosynthesis II and (D) chorismate biosynthesis II from baseline to week four of predicted metabolic pathways for IF1-P participants. Boxplot displaying a statistically significant difference in (E) adenosine nucleotides degradation IV from baseline to week four of the predicted metabolic pathway for IF2-P participants. Pathways are displayed as centered log-ratio (CLR) transformed abundances. Boxes denote the interquartile range (IQR) between the first and third quartiles, and the horizontal line defines the median.

