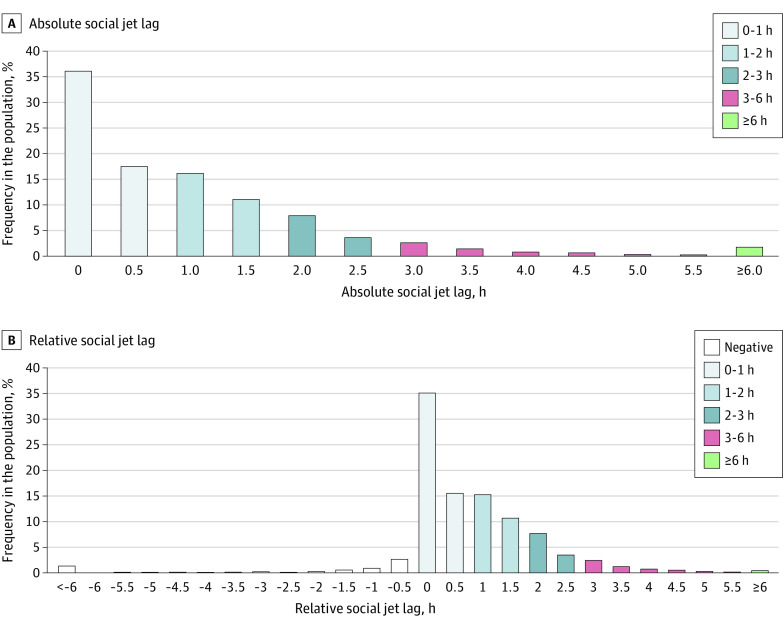
Figure 3. Distributions of Absolute and Relative Social Jet Lag.
The distribution is based on half-hour bins, except for the categories at both ends. The lowest bins of social jet lag represent less than 1 hour and less than 6 hours, the highest bins of social jet lag represent 6 hours or more, and intermediary bins include the lower and exclude the upper limit.

