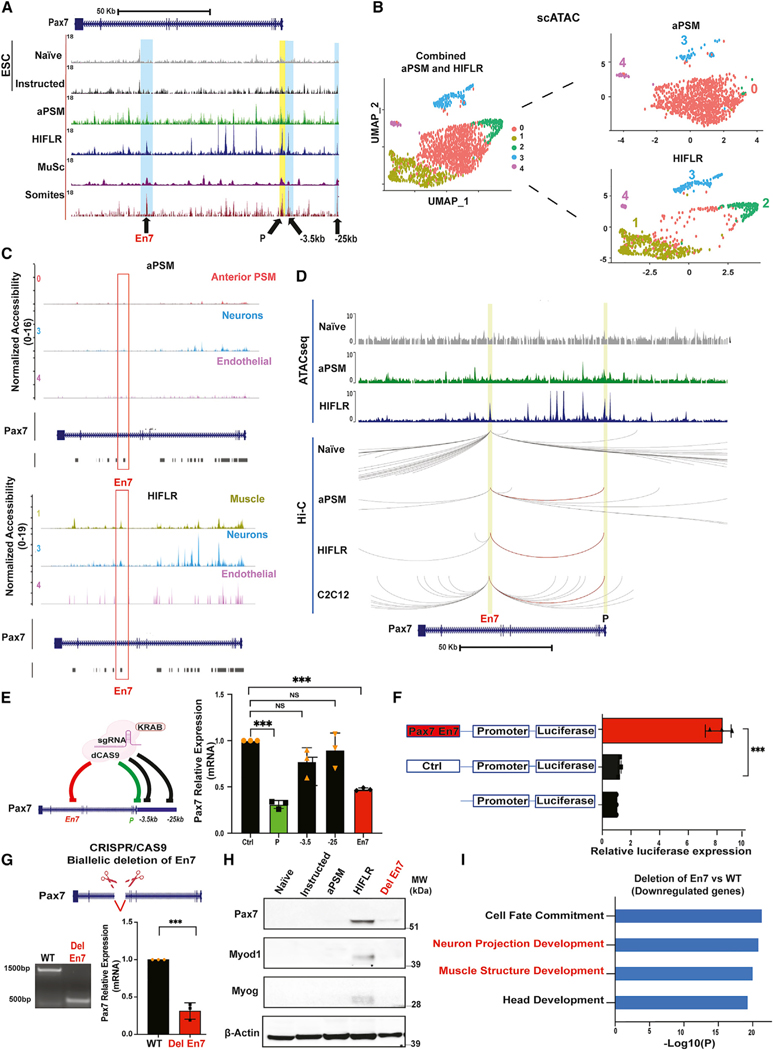
Figure 4. Identification and characterization of genomic regions regulating Pax7 expression.
(A) Genome browser representation of ATAC-seq tracks at the Pax7 locus in naive, instructed ESCs, aPSM, HIFLR, MuSCs, and E12.5 YFP+ dissected somites from Pax7+/Cre; Rosa26-YFP mice. En7 indicates a region located within the Pax7 seventh intron; P, promoter; −3.5 and −25 Kb, regions upstream the Pax7 TSS.
(B) scATAC-seq clusters of aPSM and HIFLR cells (left panel, combined clusters; right panel, aPSM and HIFLR individual clusters).
(C) scATAC-seq tracks at the Pax7 locus in aPSM (top panel) and HIFLR (bottom panel) clusters.
(D) ATAC-seq tracks and Hi-C interactions at the Pax7 locus in naive ESCs, aPSM, HIFLR, and C2C12 cells. The red line indicates En7-promoter interactions.
(E) Scheme representing gRNA-mediated dCas9-KRAB targeting of the indicated Pax7 regions in myogenic C2C12 cells (left panel). Quantitative PCR was employed to measure Pax7 mRNA in myogenic C2C12 cells transfected with dCas9-KRAB and specific or control gRNAs (right panel) Data are represented as mean ±SD (n = 3). Significance is displayed as ***p < 0.001.
(F) Luciferase assay in C2C12 cells transfected with the indicated reporter constructs. Data are represented as mean ±SD (n = 3). Significance is displayed as ***p < 0.001.
(G) Scheme representing biallelic En7 deletion (top panel). Genomic DNA electrophoresis documenting biallelic En7 deletion. Quantitative PCR was employed to measure Pax7 mRNA in control and En7-deleted HIFLR cells (bottom panel). Data are represented as mean ±SD (n = 3). Significance is displayed as ***p < 0.001.
(H) Immunoblot of Pax7, MyoD, Myogenin, and beta-actin in naive, instructed, aPSM, HIFLR, and HIFLR DelEn7cells.
(I) Gene Ontology terms of downregulated transcripts in En7-deleted HIFLR cells.

