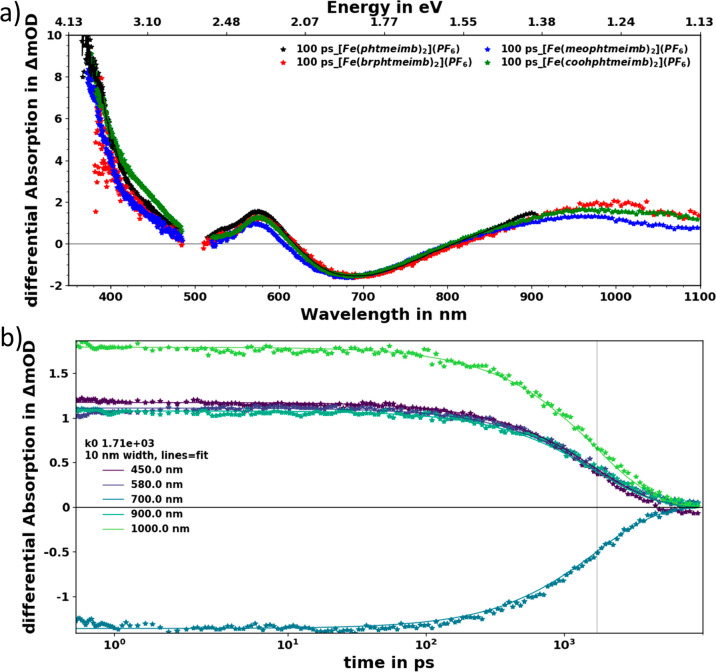
Figure 9.
(a) Measured TA spectra at 100 ps of [Fe(phtmeimb)2]PF6, [Fe(brphtmeimb)2]PF6, [Fe(meophtmeimb)2]PF6, and [Fe(coohphtmeimb)2]PF6 in acetonitrile compared. The data has been chirp and background corrected and cut to remove excitation (∼500 nm) scatter. (b) Kinetics at selected wavelengths of [Fe(brphtmeimb)2]PF6, also including the single exponential fit from global analysis (measured data is shown as symbols and the fit as solid lines). The kinetics for the other complexes are shown in Supporting Information Figures S25 and S26.

