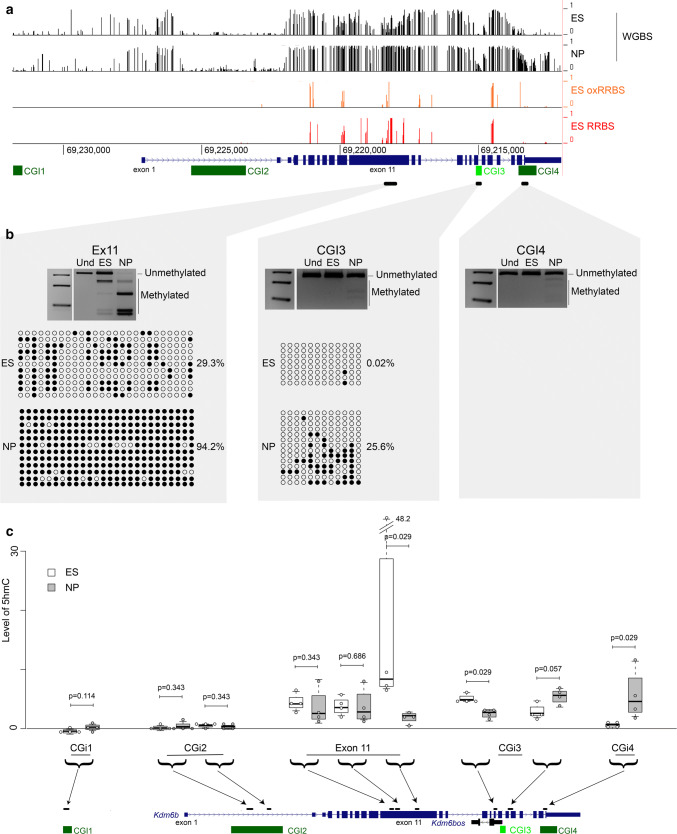
Fig. 3.
Changes in 5hmc level at the Kdm6b locus during ES cell differentiation into NP cells. a Data mining of 5mC by WGBS (ES and NP cells) and of 5hmC by comparing the RRBS and oxRRBS datasets (ES cells) at the Kdm6b locus. b Bisulfite-based DNA methylation analyses at exon 11, CGI3, and CGI4 by COBRA and/or sequencing in ES and NP cells. For each sequenced region, the methylation patterns are symbolized by lollipops (black: methylated CpG; white: unmethylated CpG). For each region, PCR analysis was repeated using 3 independent samples for ES and for NP cells that gave similar results. The results of one representative experiment are shown. c 5hmC distribution along the Kdm6b locus in ES (white boxes; n = 4) and NP cells (gray boxes; n = 4), respectively. Levels of 5hmC are given as the level of the MspI-resistant fraction at each analyzed region. Statistical significance was determined with the Mann–Whitney test (p values in the figure). The data are presented as the mean ± SEM

