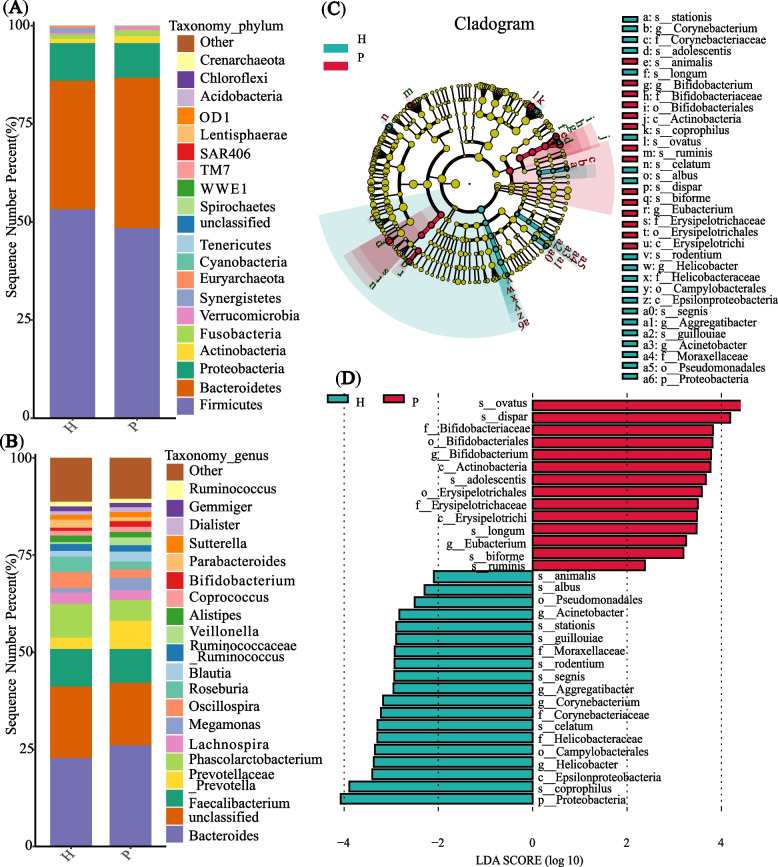
Fig. 2.
Composition and difference of the gut microbiota in P and H group. A Average relative abundance of microbiota at the phylum level and (B) at the genus level in P (n = 77) and H group (n = 24); sequences without annotations were classified as unclassified; those bacteria whose relative abundance was ranking > 20 were classified as others. C The taxonomic cladogram was generated based on the LEfSe and LDA scores. Bacterial taxa enriched in P group (red dots) and H group (green dots). D Taxa enriched in P group were indicated with a positive LDA score (red) and negative LDA score (green), respectively. Only taxa with an LDA significance threshold > 2.0 were showed in the figure; p, phylum; c, class; o, order; f, family; g, genus; s, species

