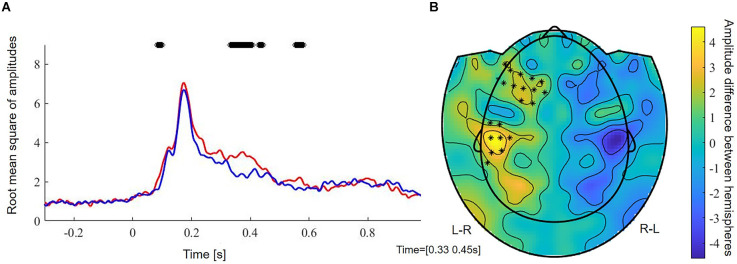
Figure 3.
(A) Root mean square of amplitudes across subjects of left (red) and right (blue) sensors. Stars reflect significant time samples. (B) Raw effect and results of cluster-based permutation test between 350 and 450 ms. Stars reflect significant sensors. L-R, activation in left minus activation in right sensors; R-L, activation in right minus activation in left sensors.

