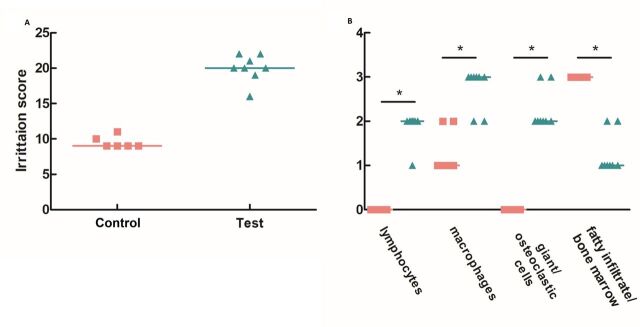
Figure 2.
Overall local tissue effects. (A) Dispersion graph of the irritation score calculated for both control (pink squares) and test (green triangles) samples. (B) Dispersion graph of the presence of the cells connected to tissue damage and cellular inflammatory response. The line denoted the median value. *Versus control samples, p<0.05, **Versus control samples, p<0.001.

