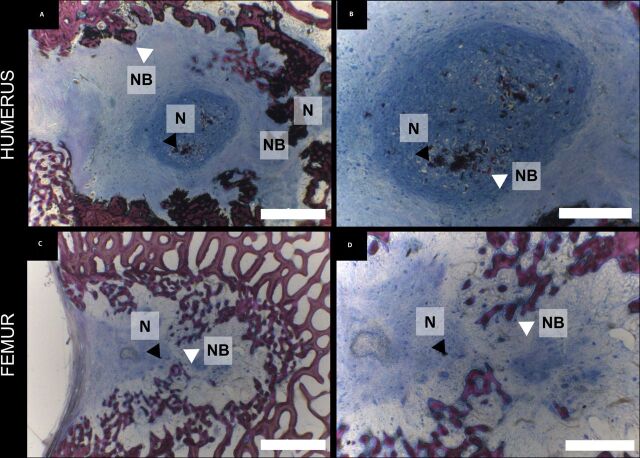
Figure 5.
Bone formation within the defect sites. (A–D) Paragon staining of PMMA embedded slices of samples from the humerus (A, B) and femur (C, D) defects at 8 weeks. Scale bar: A and C: 2 mm, B and D: 1 mm. N, nacre, NB, new bone, white arrow head points at newly formed bone around nacre crystals, and black arrow head points at nacre residues.

