
Figure 3.
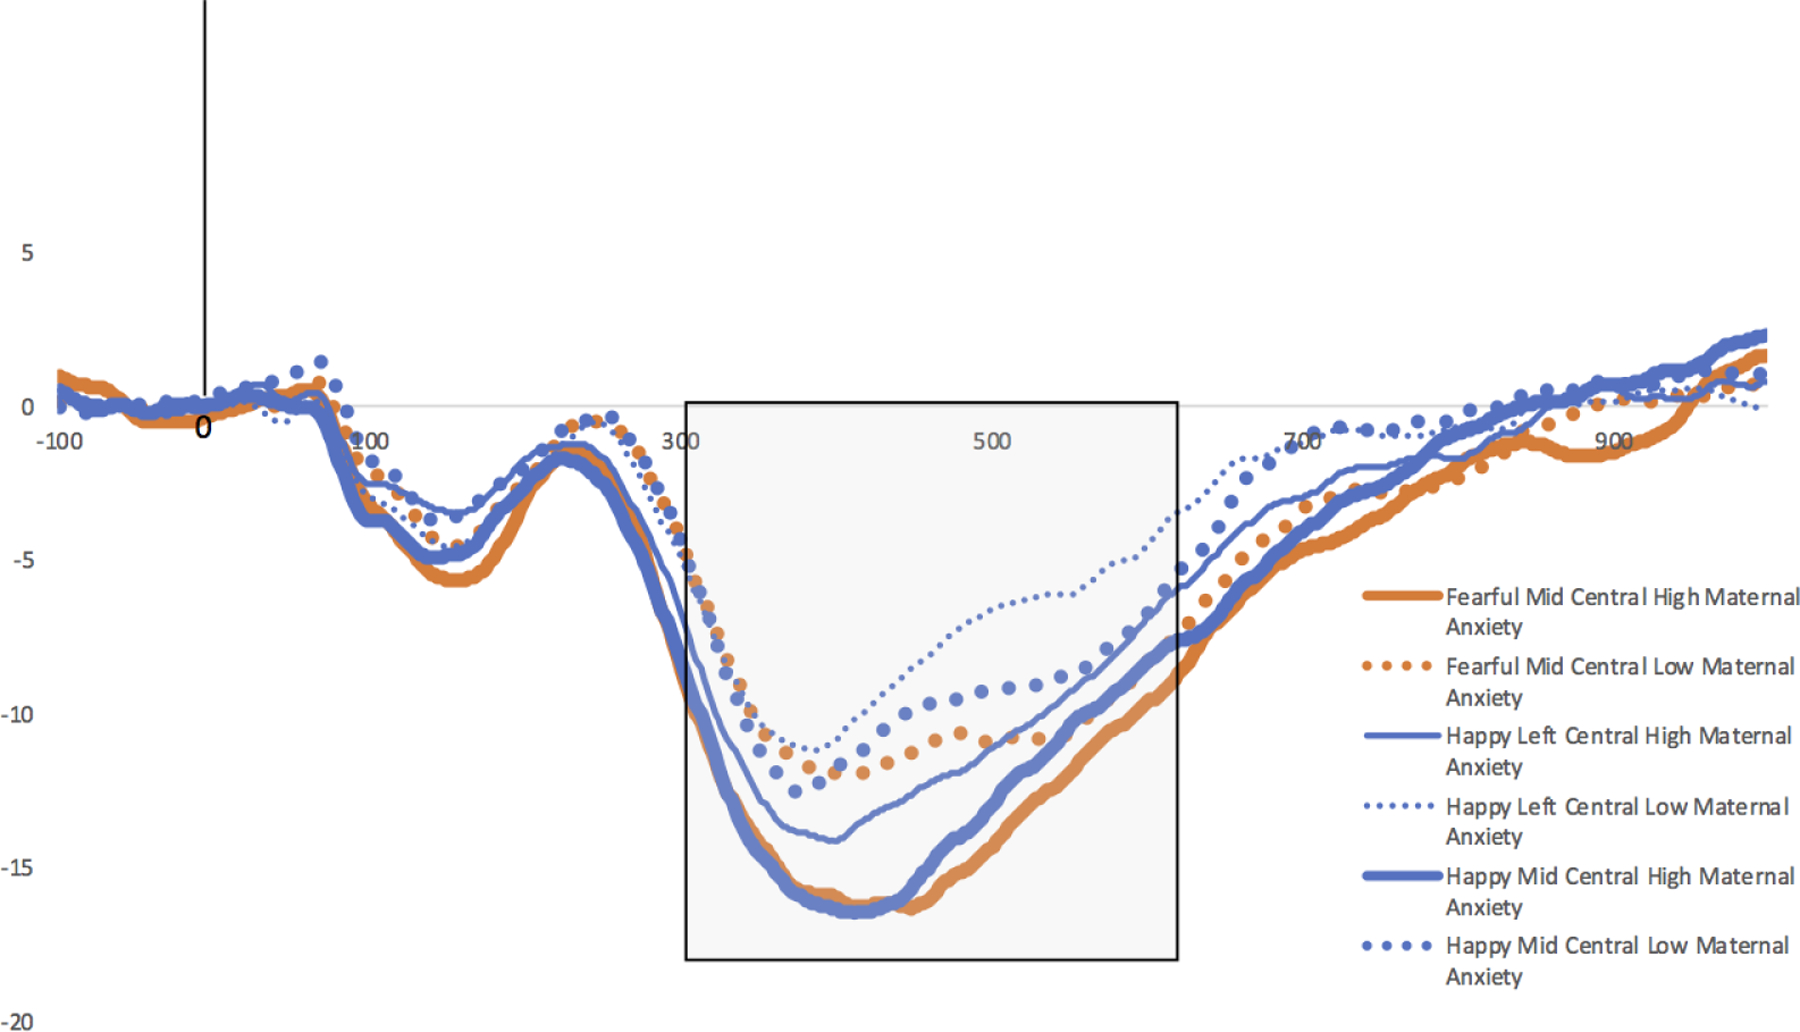
ERP amplitude for the NC in response to fearful faces in the mid-central ROI (thick orange solid and dotted lines), happy faces in the mid-central ROI (thick blue solid and dotted lines), and happy faces in the left-central ROI (thin blue solid and dotted lines). Infants of mothers reporting higher anxiety (solid lines) have more negative NCs compared to infants of mothers reporting lower anxiety (dotted lines) (+/− 2SD STAI scores used for high/low anxiety visualization). The shaded box indicates the period in which mean ERP amplitude was extracted for NC analyses.