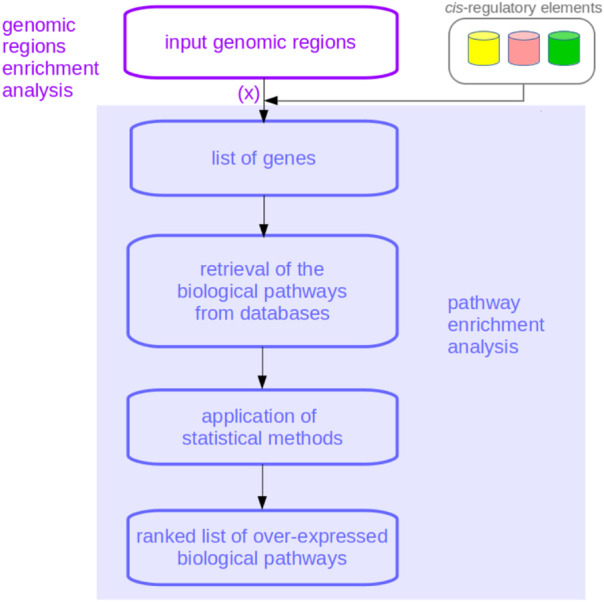
FIGURE 1.

Flowchart of a genomic regions enrichment analysis. The association of the genes corresponding to the query chromosome regions, here indicated with (x), is the phase where BEHST, GREAT, LOLA, and Poly-Enrich involve cis-regulatory elements’ data. As is evident, genomic regions enrichment analyses incorporate pathway enrichment analyses.
