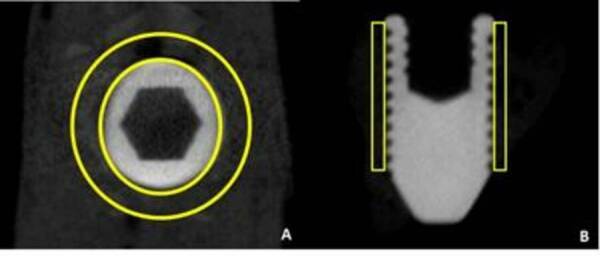
Figure 1. Scheme of the Micro CT analysis. A) Axial view of the region of interesting around the implants (Space between the yellow circles); B) Sagittal view of the region of interesting around the implants. Note that the evaluation was performed around the bony of the implants until de presence of the last thread (Space inside the yellow rectangles).

