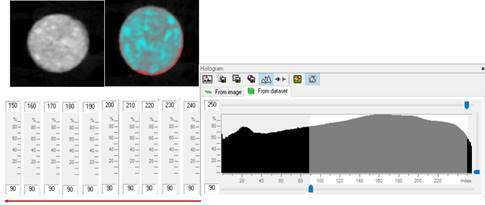
Figure 2. The trans axial images of the samples were used for the analysis of the volume of the mineralized tissues. The entire biopsies were involved in the region of interest. the NB and the GB were evaluated separately, varying the thresholds of the grayscale, in order to distinguish the mineralized tissue from the non-mineralized tissues (90-250; 90-240; 90-230; 90-220; 90-210; 90-200; 90-190; 90-180; 90-170; 90-160, and 90-150).

