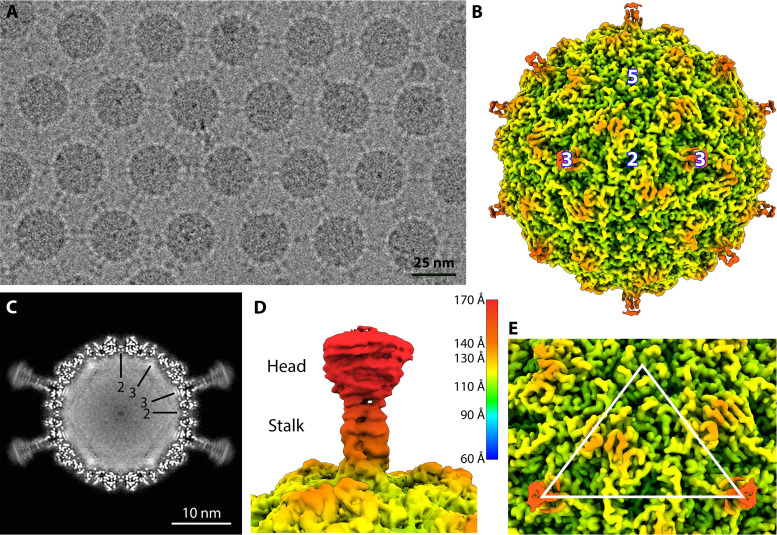
FIG 1.
Cryo-EM Analysis of φEC6098. (A) A representative micrograph of ΦEC6098 from the data collection shows an array of capsids with adjoining protrusions (scale bar, 25 nm). (B) A surface-rendered icosahedrally averaged map of ΦEC6098 (colored radially according to key) was reconstructed to 2.6-Å resolution. The 3-fold protrusions were visible only at low contour due to weaker density. Icosahedral symmetry axes are marked (white numbers). (C) The central section of the ΦEC6098 capsid shows the 3-fold protrusions. The capsid is filled with amorphous cryo-EM density corresponding to the icosahedrally averaged ssDNA genome. Icosahedral symmetry axes are shown by black lines. (D) A surface rendering of the 3-fold protrusion shown at low contour illustrates the globular head domain and narrow stalk domain, colored according to key. (E) The asymmetric unit of the icosahedral cryo-EM map is shown, marked by a white triangle.

