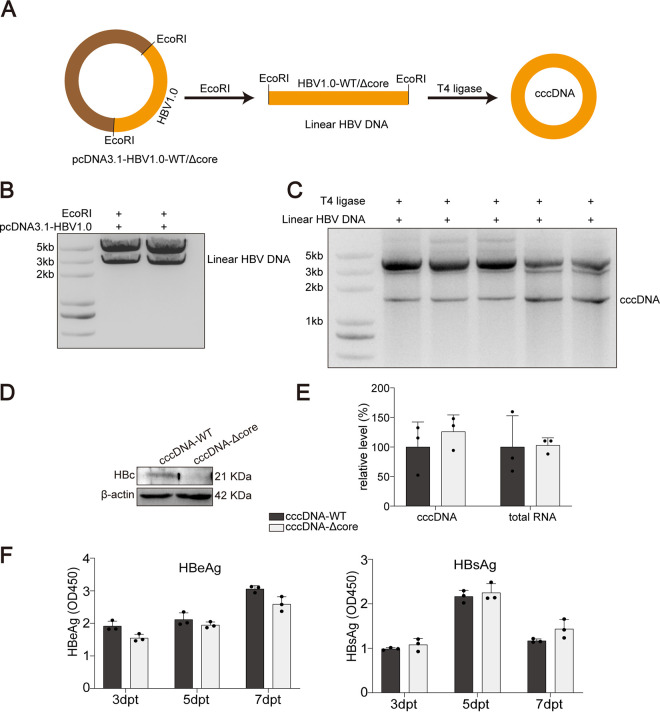
FIG 2.
Comparison of cccDNA transcription with and without HBc in cccDNA transfection model. (A) Plasmids with HBV1.0-fold genome were digested by restriction enzyme EcoRI to produce linear HBV DNA. (B and C) For obtaining cccDNA in vitro, linear HBV DNAs were self-linked by using T4 ligase. DNA gel electrophoresis was used to detect and isolate linear HBV DNA (B) and cccDNA (C). (D) Huh7 cells were transfected with cccDNA-WT or cccDNA-Δcore. The expression of HBc was tested by Western blotting. (E) The relative levels of HBV RNA and HBV cccDNA were determined by qPCR. (F) The levels of HBeAg and HBsAg in supernatants were measured by ELISA. Data were presented as mean ± SD.

