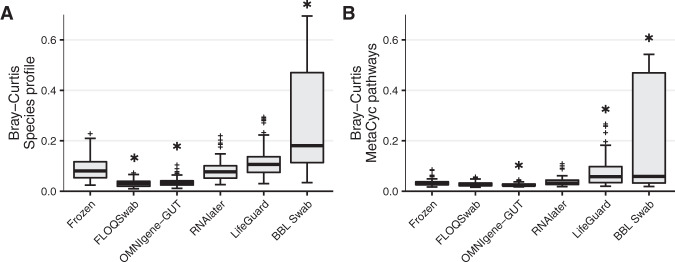
Fig. 2. Between replicate technical variability of species and functional profiles for each stabilisation method.
A Aggregated Bray-Curtis dissimilarity between replicate species profiles of all participants for each of the stabilisation methods. B Aggregated Bray-Curtis dissimilarity between replicate functional profiles of all participants for each of the stabilisation methods. * = FDR P value < 0.05 compared to frozen samples. Significance was assessed by linear mixed effect regression (LMER).

