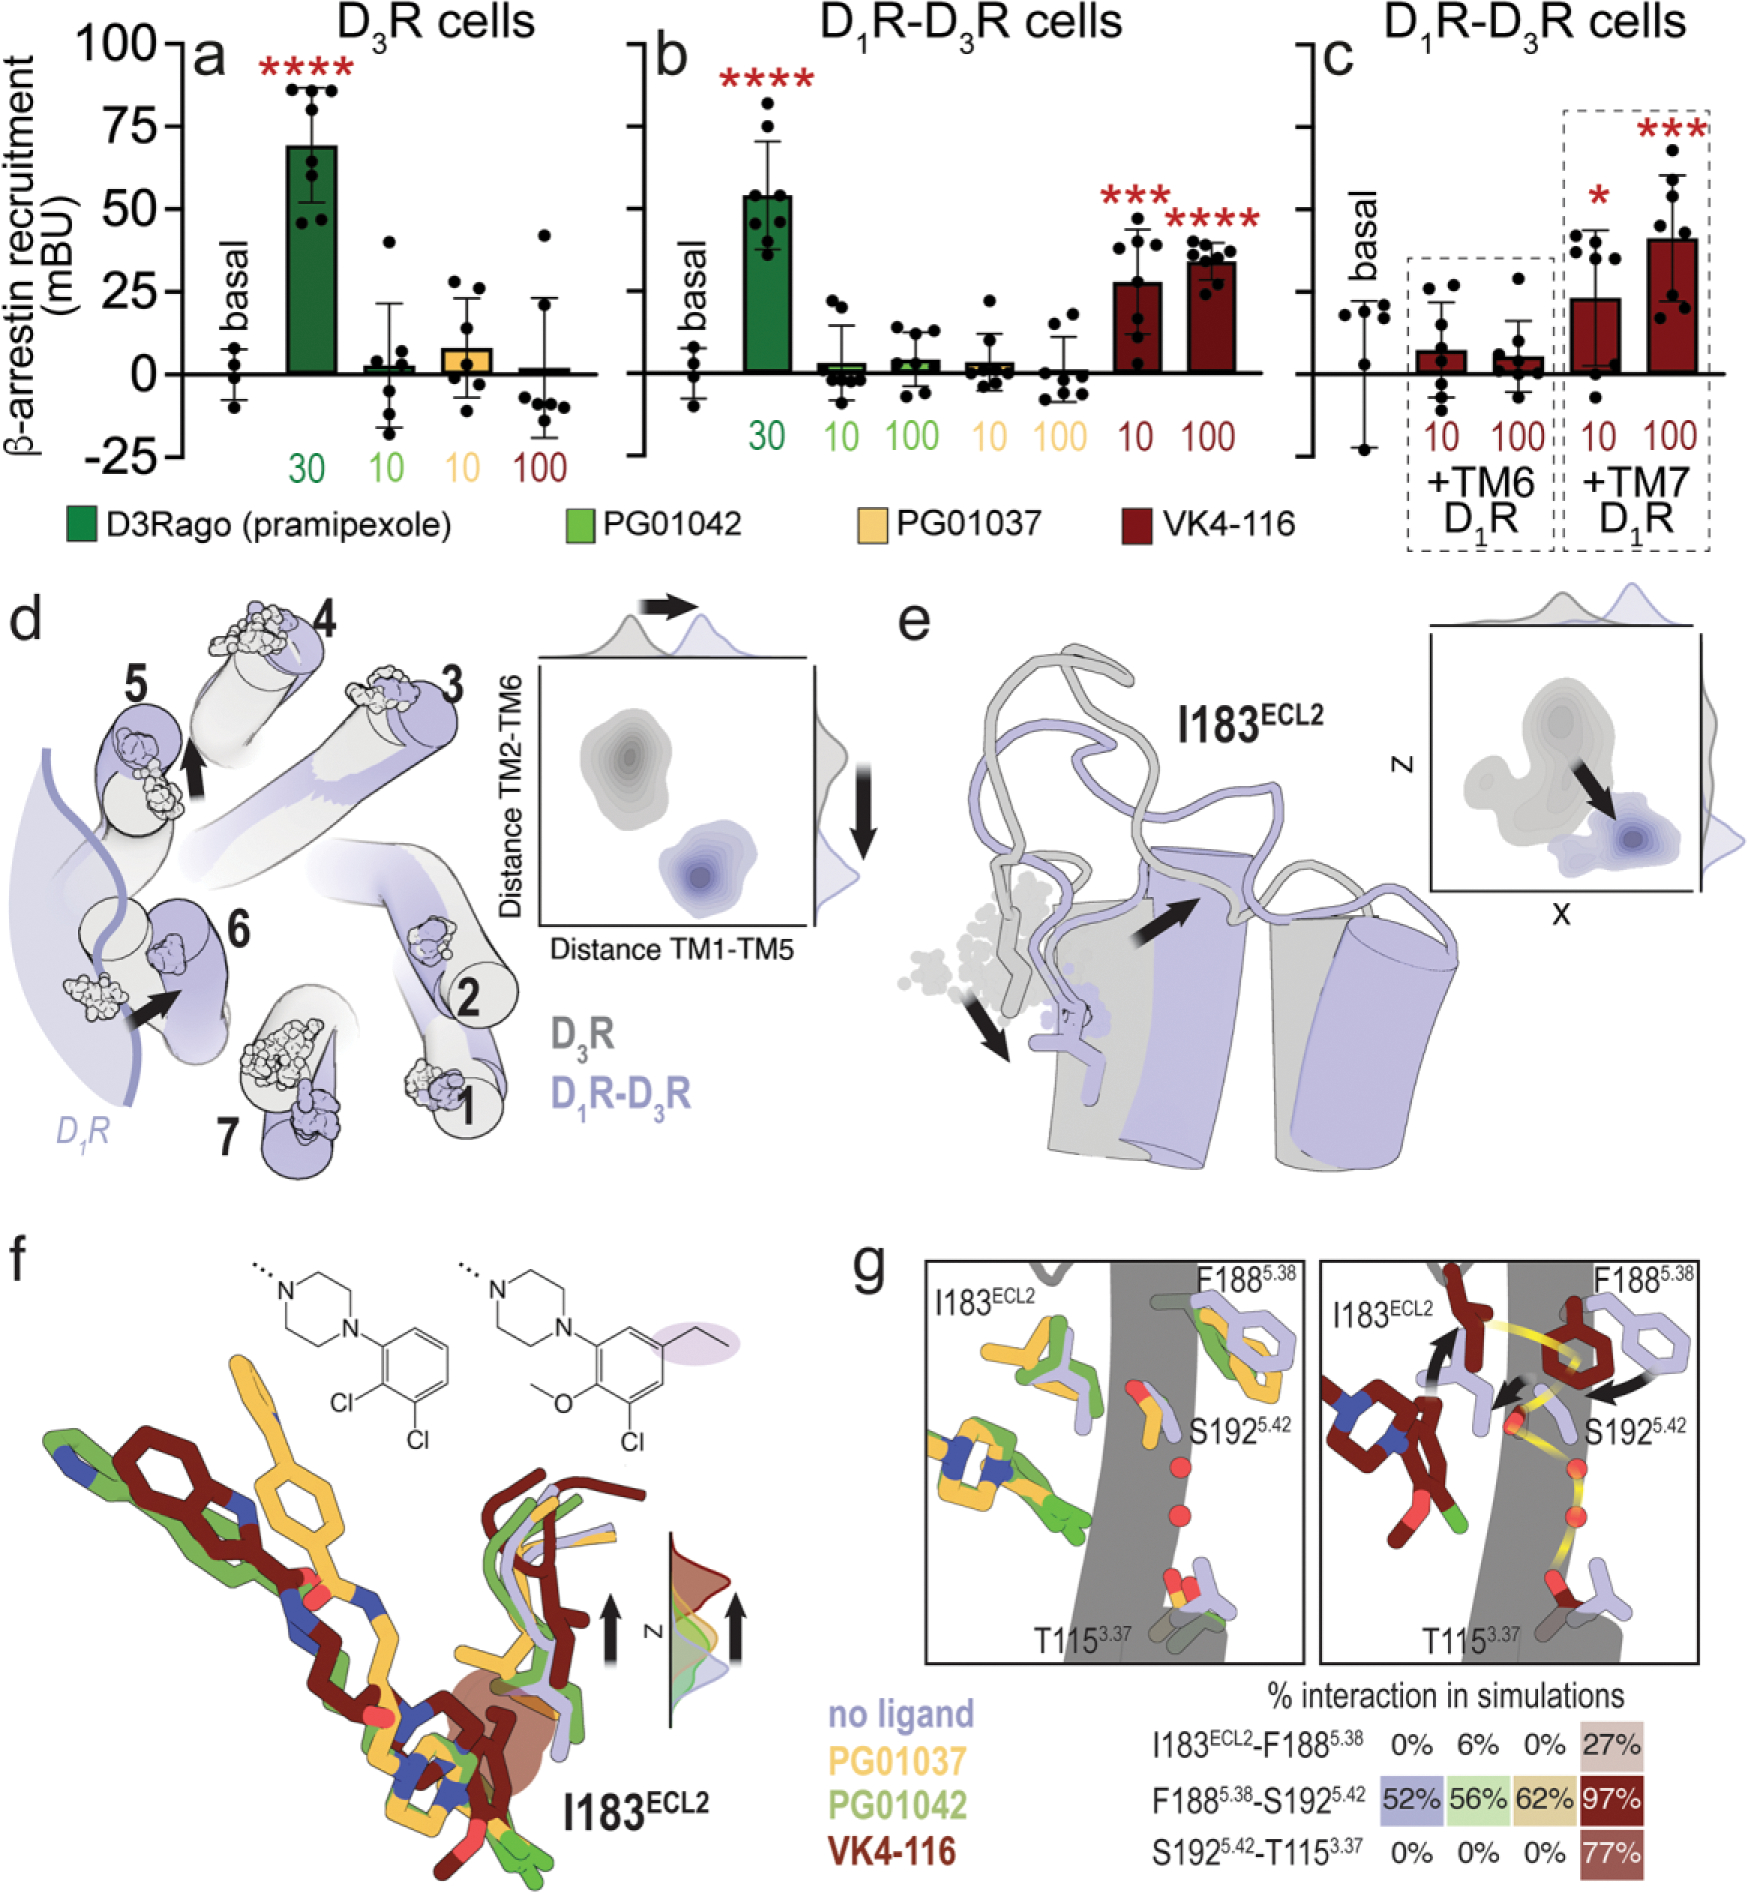
Figure 2. Differential effects of PG01042, PG01037, and VK4-116 on β-arrestin recruitment in HEK-293T cells transfected with D3R and D1R.

a-c. Results from β-arrestin recruitment experiments in HEK-293T cells transfected with β-arrestin-1-Rluc cDNA (0.5 μg), D3R-YFP cDNA (1 μg cDNA) with or without D1R cDNA (1.5 μg cDNA) (D1R-D3R cells and D3R cells, respectively). In a-b, cells are treated for 10 min with the D2-like receptor agonist pramipexole (D3Rago; 30 nM) or the D3R ligands PG01042, PG01037 and VK4-116 (10 or 100 nM). In c, cells are pre-treated or not with D1R TM6 or TM7 peptides (4 μM for 4 h) and with VK4-116 (10 or100 nM) for 15 min before the D1R agonist SKF81297 (30 nM; D1Rago). Coelenterazine H (5 μM) was added before pramipexole or the selective D3R ligands for 7 minutes and β-arrestin-1 recruitment was measured by BRET (see Material and Methods). Values are mean ± S.D. (n = 8). *, *** and ****: p < 0.05, p < 0.001 and p < 0.0001 versus basal, respectively (one-way ANOVA followed by Dunnett’s post hoc comparisons). d. Evolution of the Cα atoms (spheres) of Y321.35 in TM 1, L892.64 in TM 2, I1013.23 in TM 3, F1704.62 in TM 4, F1885.38 in TM 5, H3546.60 in TM 6, and P3627.32 in TM 7 during three replicas of unbiased 1 μs MD simulations of the D3R monomer (gray) and the D1R-D3R heteromer (blue) with no ligand bound. Contour plots of the distances between Y321.35 in TM 1 and F1885.38 in TM 5 (distance TM1-TM5) and between L892.64 in TM 2 and H3546.60 in TM 6 (distance TM2-TM6) during the MD simulations. Distributions of these distances are shown in the axes. e. Evolution of I183ECL2 (spheres), and contour plots and distributions of X,Z coordinates corresponding to the Cb atom of I183ECL2 during MD simulations. Black arrows represent the movements of D3R in the D1R-D3R heteromer (blue) relative to the D3R protomer (gray). f. Detailed view of I183ECL2 of D3R in the D1R-D3R heteromer during MD simulations with no ligand bound (blue) and PG01042 (green), PG01037 (orange) and VK4-116 (red) bound to D3R. Distributions of the Z coordinate corresponding to the Cα atom of I183ECL2 during MD simulations. The ethyl group of VK4-116 that triggers the upward movement of I183ECL2 is highlighted. g. Detailed views of I183ECL2, F1885.38, S1925.42, and T1153.37 of D3R in the D1R-D3R heteromer during MD simulations with no ligand bound (blue) and PG01042 (green), PG01037 (orange) and VK4-116 (red) bound to D3R. Frequency contacts (%) between side-chain residues, color-coded according to the ligand bound to D3R, as calculated with the GetContacts software. Black arrows represent the movements of these side chains of D3R relative to the unliganded D3R (blue). The xy plane is as defined by the Orientations of Proteins in Membranes (OPM) [73].
